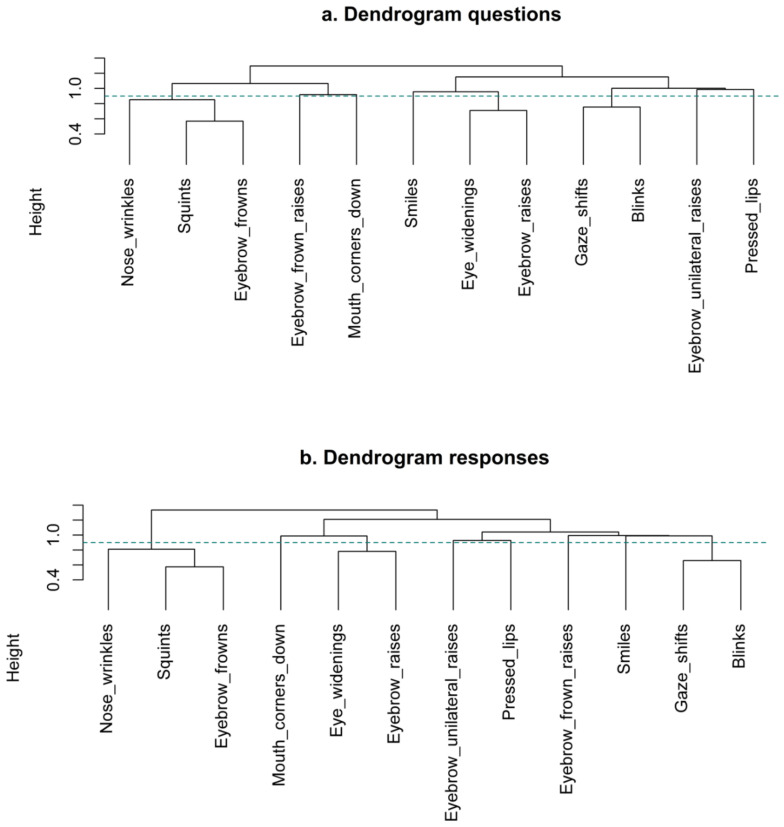
Figure 8.
Cluster dendrogram of categorical variable groups for questions (a) and responses (b). In the dendrogram, the y-axis represents the distance between clusters. The smaller the height at which two facial signals are joined together, the more similar they are. The bigger the height, the more dissimilar. The horizontal bars indicate the point where the clusters are merged. The eight-cluster solution is indicated below the green horizontal dashed line through the dendrogram.

