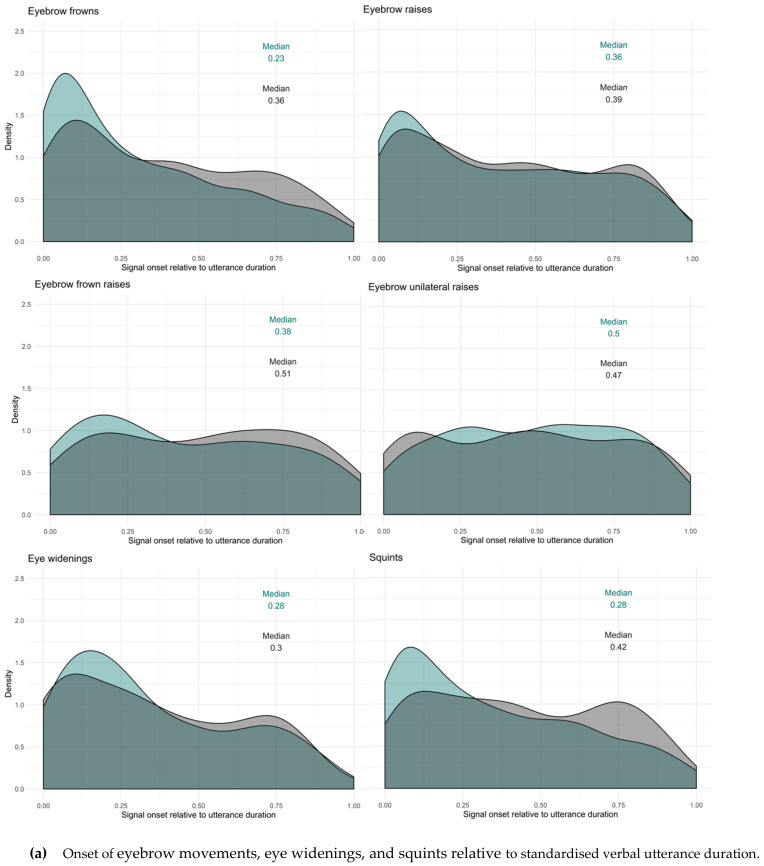
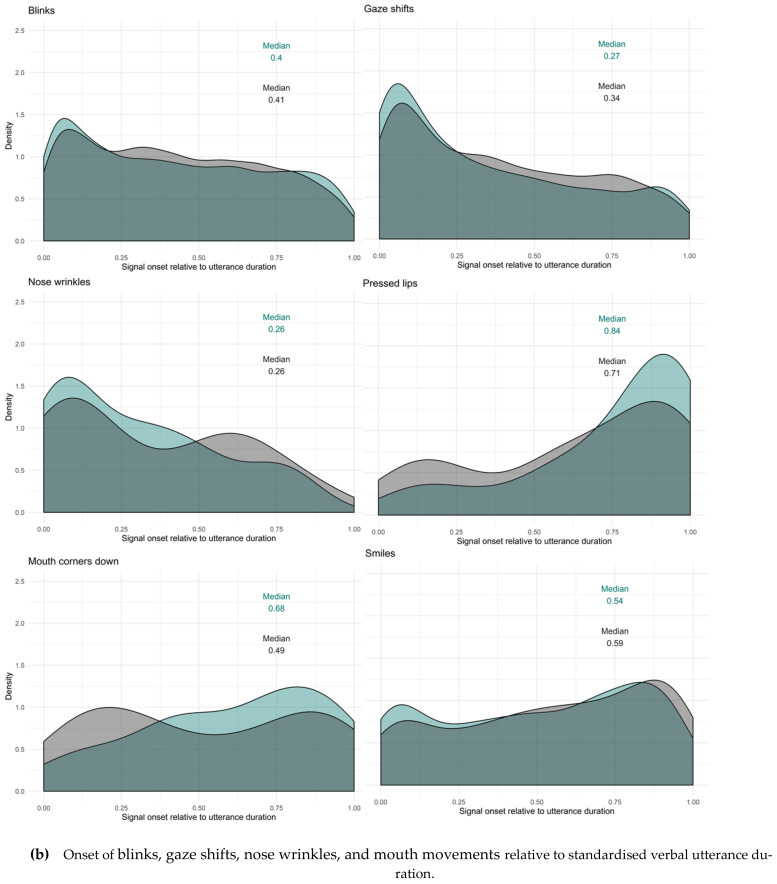
Figure 12.
Facial signals onset relative to standardised verbal utterance duration (panel a and b). Question (green) and response (grey) median indicated in the figures. These figures represent the facial signals onsets relative to the verbal utterance duration, therefore, pre- and post-utterance onsets were not included.


