Figure 5.
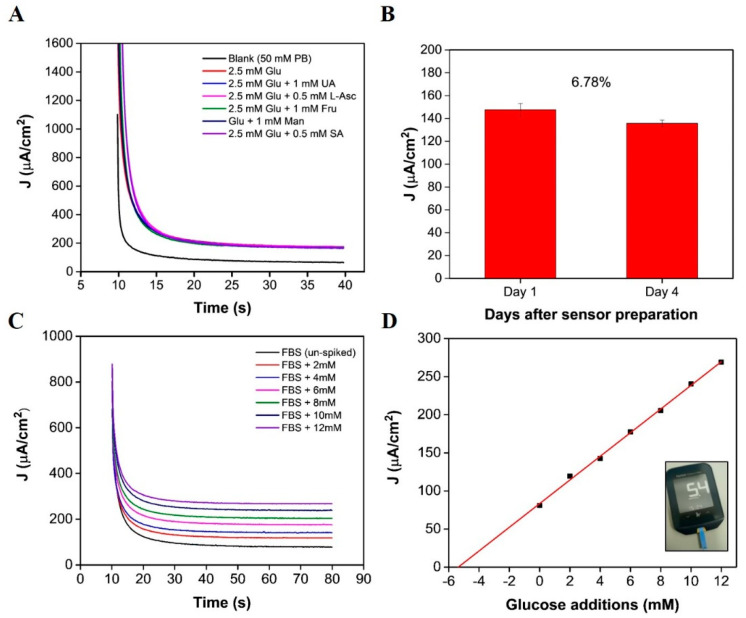
(A) Chronoamperometric response of the on-chip biosensor to a blank solution (50 mM PB, pH 7.4), to 2.5 mM glucose and to separate aliquots of 2.5 mM glucose + other potential interfering species (L-ascorbic acid (L-A) fructose (Fru), mannose (Man), uric acid (UA) and salicylic acid (SA); (B) bar chart depicting the 2.5 mM concentration measured after 1 day of storage and a 2.5 mM concentration measured 4 days after storage (error bars represent std. dev between 50 data points obtained from 20–40 s current sampling time of measurement); (C) chronoamperometric response of the sensor in 100% fetal bovine serum spiked with known concentrations of glucose; (D) corresponding standard addition for subfigure (C) (inset image shows 1 of 10 measurements obtained in FBS).

