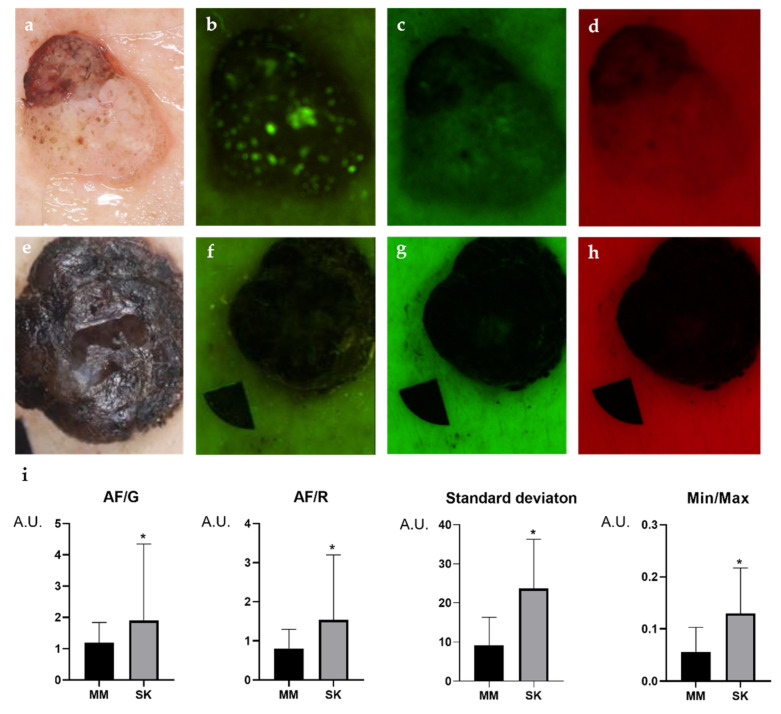
Figure 2.
Multispectral LED images comparing SK (a–d) to malignant melanoma (e–h), and the results of statistical analysis of intensity parameters (i). Dermoscopic images of the lesions (a,e), 405 nm autofluorescence (AF) channel (b,f), 525 nm green (G) (c,g) 660 nm red (R) channel images (d,h). Welch’s t-test was used to compare the intensity values of the lesions. In SKs, all the intensity values were significantly higher compared with melanomas (i). The AF/G and AF/R ratios were normalized to adjacent control skin. A.U., arbitrary unit. p values below 0.0001 were considered statistically significant. Means ± SD: AF/G: 1.187 ± 0.647 (MM) vs. 1.891 ± 2.437 (SK), AF/R: 0.809 ± 0.48 (MM) vs. 1.53 ± 0.48 (SK), Standard deviation: 9.23 ± 7.1 (MM) vs. 23.6 ± 12.58 (SK), Min/Max: 0.056 ± 0.045 (MM) vs. 0.129 ± 0.087 (SK). * p < 0.05.

