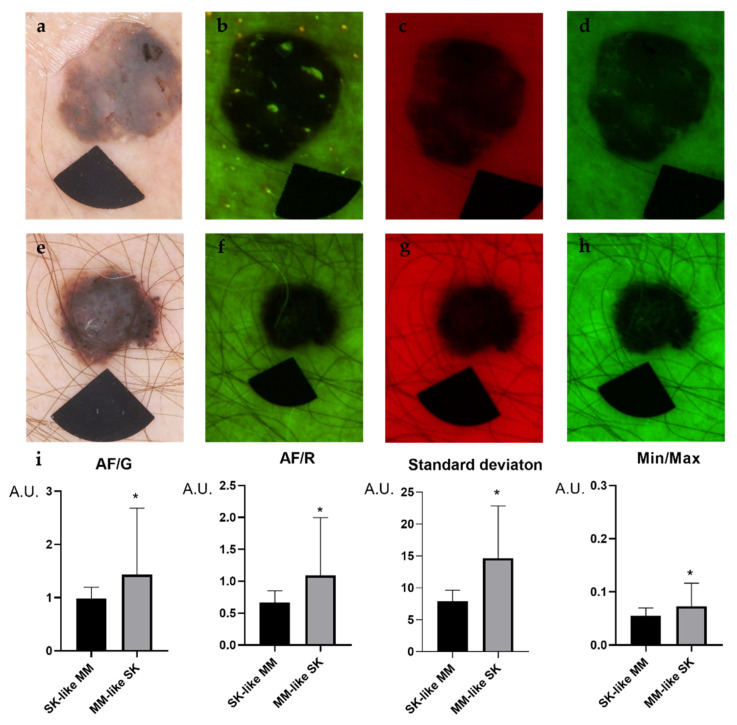
Figure 3.
Representative images of clinically challenging melanoma (MM)-like SKs and SK-like MMs. The upper row is an SK-mimicking melanoma (MM) (nodular melanoma, Breslow:1.84, Clark III., pT2a) while the lower row is a melanoma-resembling SK. Dermoscopy images of the lesions (a,f), 405 nm autofluorescence (AF) channel (b,g), 660 nm red (R) channel images (c,h) 525 nm green (G) (d,i) and the results of particle analysis (e,j). Welch’s t-test was used to compare the intensity values of the lesions. In SKs, all of the intensity values were significantly higher compared with melanomas (i). A.U., arbitrary unit. p values below 0.05 were considered statistically significant. Means ± SD: AF/G: 0.984 ± 0.212 (SK like MM) vs. 1.415 ± 1.215 (MM like SK), AF/R: 0.667 ± 0.183 (SK like MM) vs. 1.08 ± 0.884 (MM like SK), Standard deviation: 7.9 ± 1.745 (SK like MM) vs. 14.79 ± 7.96 (MM like SK), Min/Max: 0.05 ± 0.01 (SK like MM) vs. 0.073 ± 0.043 (MM like SK). * p < 0.05.

