Figure 6.
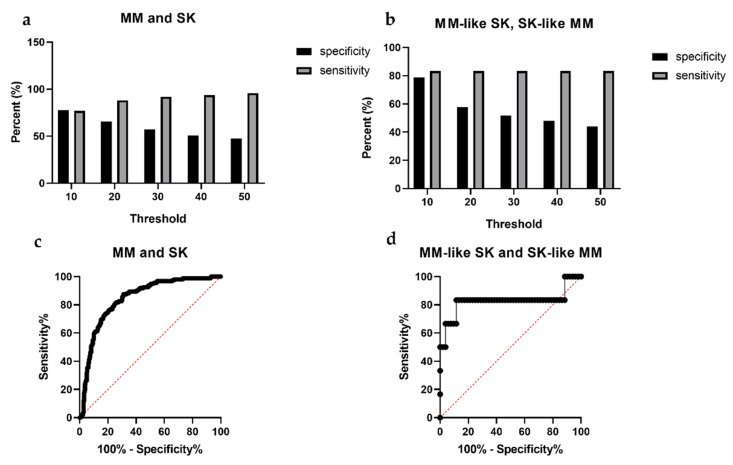
Sensitivity and specificity values using different SK index threshold parameters and receiver operating characteristic (ROC) curves for melanoma prediction. Melanoma (MM) group compared to SK group (a) and MM-like SK group compared to SK-like MM (b). We used different thresholds of the SK index and 30 proved to be the most suitable for a screening device, where the sensitivity is 91.9% (over 90%) and specificity is 57.0% (over 50%). Setting the right threshold was important from the aspect of the sensitivity and specificity for a potential screening tool. The 30 threshold was suitable with a sensitivity of 83.3% and specificity of 51.9% for a potential screening device. ROC was performed to show the differences between the comparison of the MM and SK (c) and MM-like SK and SK-like MM groups (d). The Area Under the Curve (AUC) was 0.844 (patients: MM, control: SK, 95% confidence interval, p < 0,0001) in the MM and SK ROC curve (c). AUC was 0.826 (patients: SK-like MM, control: MM-like SK, 95% confidence interval, p = 0.0092) in ROC curve of the MM-like SK and SK-like MM comparison. Y-axis: sensitivity, x-axis: 1-specificity. Red diagonal dotted line represents a non-discriminatory test (c,d).

