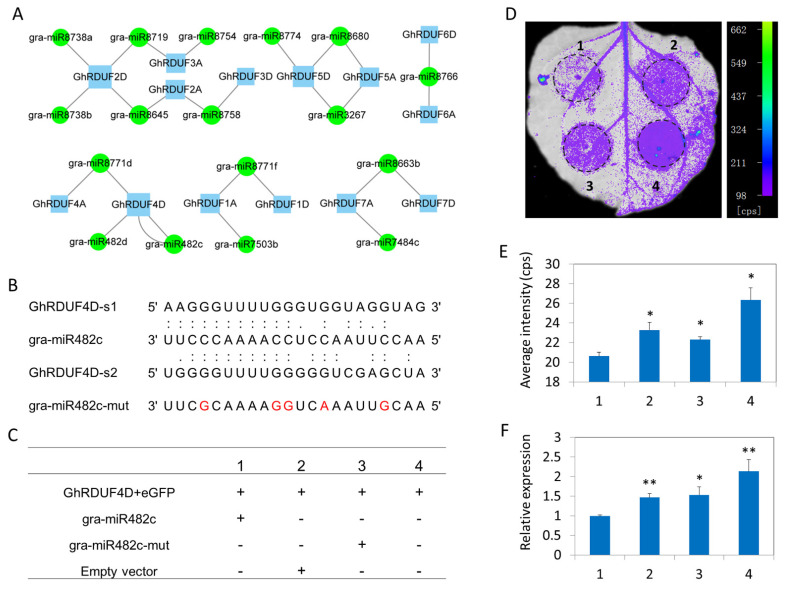
Figure 5.
miRNAs targeting the GhRDUF genes, and the regulatory network of GhRDUF4D and gra-miR482c. (A) Network of miRNAs and the target GhRDUFs. The predicted regulation miRNAs are shown on a green background in circles, the target GhRDUF genes are marked with blue rectangles. The regulation and targeting level are shown with varying degrees. (B) The base-pairing interaction between gra-miR482c and GhRDUF4D, and the sequence of mutant gra-miR482c. The five point mutations in gra-miR482c-mut are marked in red. (C) Vector groups in transient expression assays for each lane. (D) Co-infiltrated tobacco leaves photographed under ultraviolet light. The same areas marked by circular dotted lines were used for fluorescence intensity and gene expression analyses. (E) The average fluorescence intensity in each lane. (F) Relative expression levels of GFP in each lane. Mean ± standard error (SE), n = 3. “*” and “**” indicate that the data were significantly different at the p values of <0.05 and <0.01, respectively.

