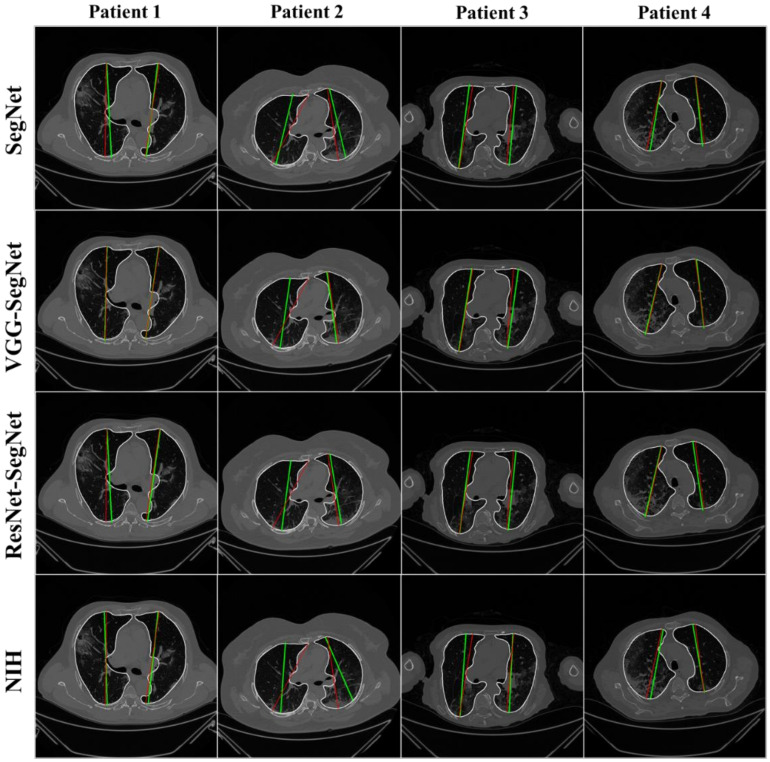
Figure 15.
Display of the AI-long axis (green) and GT-long axis (red) showing the reach of the top apical zone and bottom basal zone of the left and right lungs. Rows are the four models, and columns are sample four patients COVID-19 CT scans. White is the GT delineated borders of the lungs by the tracer using ImgTracer(TM).

