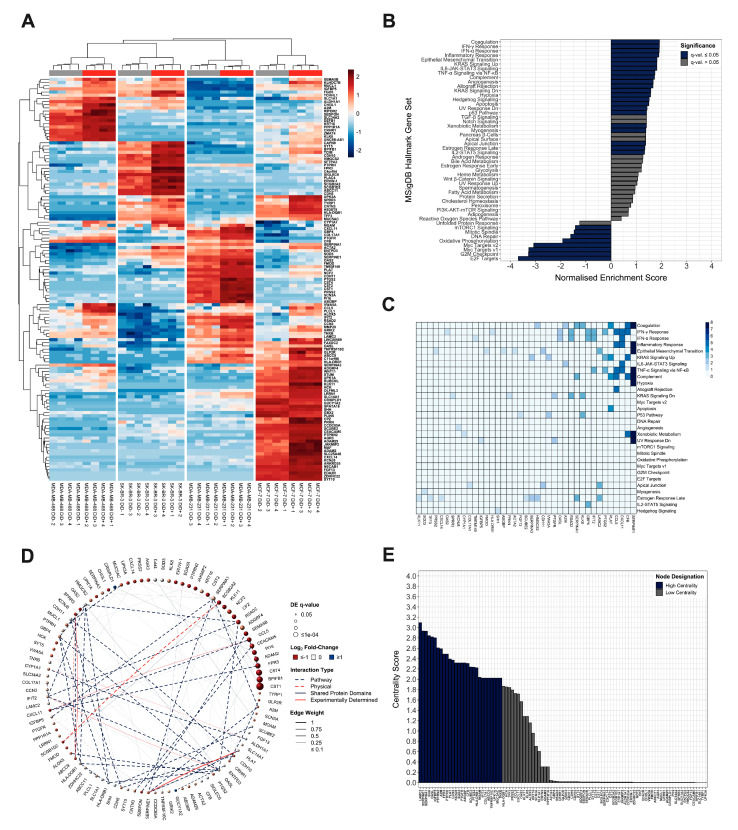
Figure 2.
Ontological and Functional Analysis of the Quiescent Breast Cancer Cell Transcriptome. (A) Agglomerative hierarchically clustered heatmap of mean-centered, TMM normalised log2-transformed CPM gene expression values as quantified by mRNA-Seq. Clustering is unsupervised and based on Euclidean distances calculated from an average-linkage matrix. All genes detected as differentially expressed with a log2 fold-change significantly above 1.5 (up-regulated) or below −1.5 (down-regulated) at an FDR-adjusted p-value (q-value) ≤ 5% across all breast cancer cell lines are shown (127 total). Grey and red bars represent Vybrant® DiD−negative (DiD−) and Vybrant® DiD− positive (DiD+) grouping, respectively. (B) Gene set enrichment analysis of the differentially expressed genes using MSigDB hallmark collection gene ontologies denoted by enrichment score normalised to mean enrichment of randomised equivalent samples (hypergeometric test with post-hoc Benjamini-Hochberg FDR adjustment). (C) Analysis of leading edge genes identified as driving significant enrichment of MSigDB hallmark collection gene sets. Columns indicate quiescence-associated signature genes contributing to the enrichment signal of the gene set(s) indicated by row labels. Colour is scaled to the number of leading edge gene sets in which each gene appears. For clarity, only signature genes that appear in ≥1 ontologies are shown. (D) Composite functional association network constructed for genes detected as differentially regulated with a log2 fold-change significantly above 1.5 (up-regulated) or below −1.5 (down-regulated) at an FDR-adjusted p-value (q-value) ≤ 5% across all four breast cancer cell lines. For clarity, only empirically determined (non-inferred) network members are shown. Vertex (circle) size is proportional to FDR-adjusted p-value of differential regulation (q-value); node colour is proportional to the log2 fold-change between proliferative and quiescent breast cancer cells. Connecting edge (line) colour and type represents interaction relationship. Edge thickness is proportional to linear regression–derived network weighting. (E) Topological analysis of the quiescence-associated signature gene network. Centrality score represents the log10 transformed combined centrality metrics (total degree, betweenness, eigenvalue, and closeness) calculated during topological analysis. Genes with combined centrality scores in the upper−quartile (75th percentile) are designated as “high centrality” while those that failed to meet this cut-off as “low centrality”.

