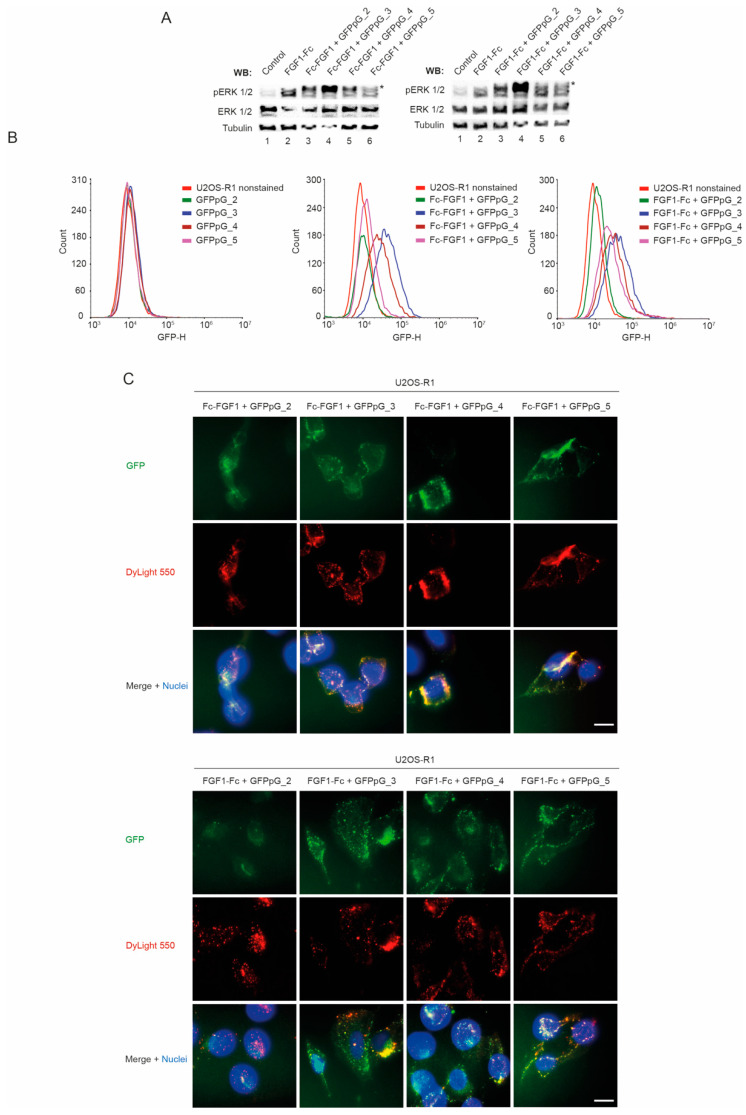
Figure 6.
Biological activity of FGF1 and GFPpG complexes. (A) Serum-starved NIH3T3 cells were incubated for 15 min with Fc-FGF1 or FGF1-Fc and each of GFPpG variant. Mix of proteins were added in the presence of heparin (10 U/mL). Cells were lysed and activation of receptor-downstream ERK1/2 signaling was assessed with Western blotting (with antibodies recognizing phosphorylated ERK1/2 (pERK1/2)). The level of tubulin served as a loading control. (B) Efficiency of FGF1 and GFPpG complexes internalization analyzed by flow cytometry. Serum-starved U2OS-R1 cells were treated with fluorescent GFPpG variants and Fc-FGF1 or FGF1-Fc. After 20 min of incubation on ice, cells were transferred to 37 °C for 30 min, and then subsequently analyzed by NovoCyte 2060R Flow Cytometer. (C) FGFR1-mediated internalization of FGF1 and GFPpG multivalent complexes. U2OS-R1 cells were incubated with each of GFPpG variant (green) and DyLight 550 NHS Ester labeled Fc-FGF1 or FGF1-Fc (red) for 20 min on ice, and then for 45 min at 37 °C. Nuclei were stained with NucBlue Live. Cells were fixed and visualized using wide-field fluorescence microscope. The scale bar represents 20 μm. *—nonspecific signal from GFPpG.

