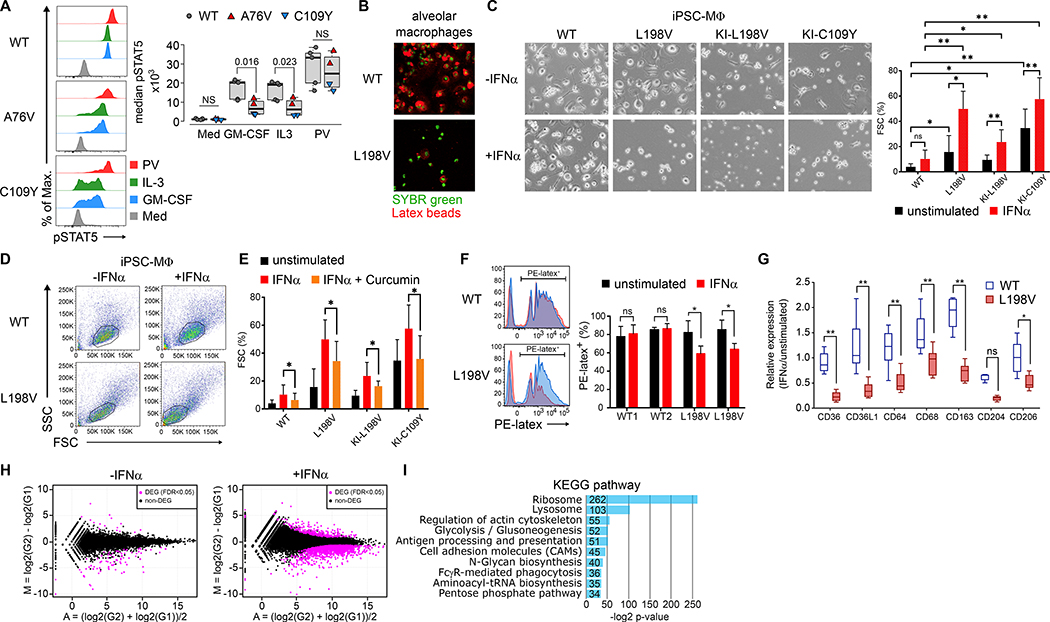
Fig. 3. Interferon-α induced RNase L-dependent dysfunction of monocyte and iPSC-derived macrophages.
(A) Overlay histograms of phosphorylated STAT5 (pSTAT5) in monocytes of unstimulated (Med), GM-CSF-, IL-3-, and pervanadate- (PV) stimulated PBMCs and summary of median pSTAT5 from 5 different OAS1-WT (gray), A76V (red), and C109Y (blue) from 3 independent experiments. (B) Fluorescence microscopy of OAS1-WT and L198V alveolar macrophages (green nuclear staining) and phagocytosed PE-latex beads (red). (C) Bright-field microscopy of OAS1-WT, L198V, KI-L198V, and KI-C109Y iPSC-MΦ either unstimulated or IFNα-stimulated (−/+IFNα) for 48 hours, and summary graph of proportions of floating single cells (FSC) of total live iPSC-MΦ unstimulated (black) or IFNα-stimulated (red) from 3 independent experiments. (D) Pseudo-color plots of OAS1-WT and L198V iPSC-MΦ unstimulated or IFNα-stimulated for 7 days. (E) Proportions of floating single cells (FSC) of total live OAS1-WT, L198V, KI-L198V iPSC-MΦ, and KI-C109Y iPSC-MΦ unstimulated (black), IFNα- (red), and curcumin (orange) stimulated/inhibited for 48 hours from 3 independent experiments. (F) Histogram overlays of PE-latex beads phagocytosed by OAS1-WT and L198V iPSC-MΦ unstimulated (black) or IFNα- (red) stimulated for 48 hours and summary graph of 2 OAS1-WT and 2 L198V clones analyzed in 3 independent experiments. (G) Relative expression levels of surface scavenger receptors of OAS1-WT (white) and L198V (red) iPSC-MΦ unstimulated and IFNα-stimulated for 48 hours from 3 independent experiments. (H) MA-plot visualization of DEGs (magenta) with a FDR <0.05 between unstimulated and 48 hours IFNα-stimulated OAS1-WT and L198V iPSC-MΦ. (I) KEGG-based GSEA of down-regulated DEG in IFNα-stimulated L198V iPSC-MΦ as compared to OAS1-WT. Significance levels are calculated with two-sided paired t-test and indicated in the summary graphs (ns = non-significant, * p<0.05, ** p<0.005, error bars, mean ± s.d.).

