Figure 3.
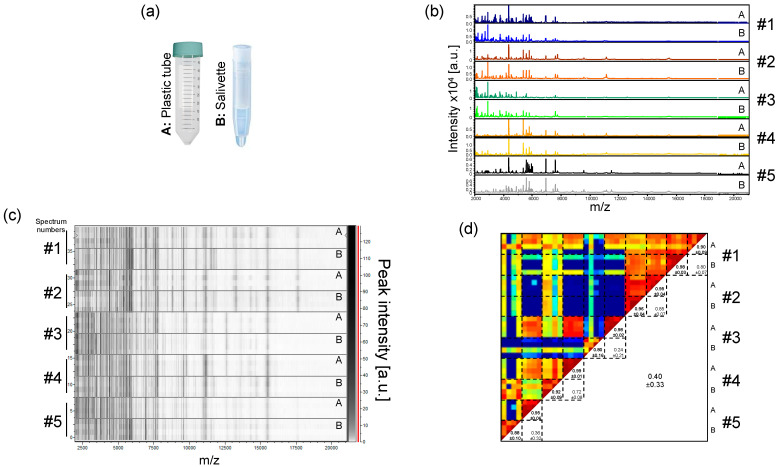
Comparison of saliva MS profiles from healthcare workers collected with two distinct systems. (a) Representation of the two saliva collection systems used. (A) Plastic tube; (B) Salivette®. (b) Representative saliva MS spectra collected either directly in plastic tube (A) or in a Salivette system (B) from five healthcare workers. (c) Gel view of the saliva MS profiles from the same five healthcare workers. The four replicates loaded on the MS plate for each individual per saliva collection system are presented. The gray scale in the right part of the panel correspond to the MS peak intensity level in arbitrary units (a.u.). (d) Composite correlation index (CCI) matrix representing the levels of MS spectra reproducibility between saliva samples. CCI are expressed as the mean ± standard deviation. #1 to #5: healthcare workers.

