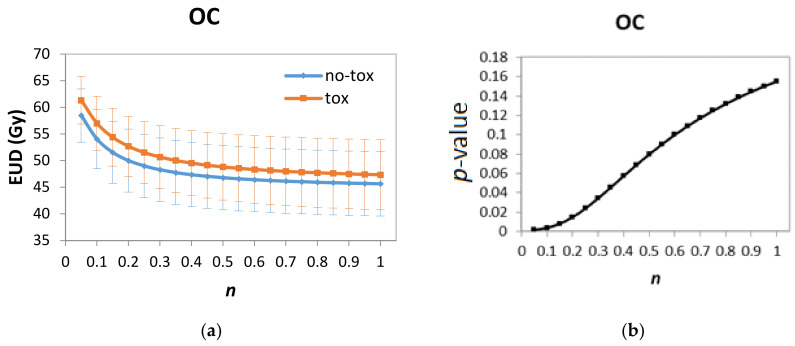
Figure A1.
(a) Average Equivalent Uniform Dose (EUD) and standard deviations for oral cavity as a function of the volume parameter n used to calculate EUD. Results for patients with (red line, label “tox”) and without (blue line, label “no-tox”) where grade ≥ 2 acute salivary dysfunction is reported. (b) The p-values for the t-test comparing average EUDSs for patients with and without toxicity. The differences are statistically significant for n in the range 0.05–0.35.

