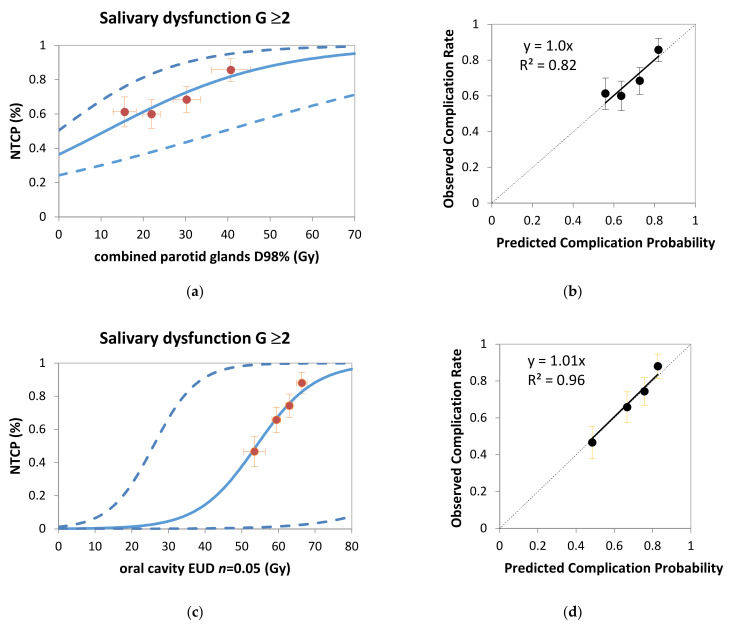
Figure A3.
Probability of grade ≥ 2 acute salivary dysfunction as a function of D98% of combined parotid glands (panel (a)) and oral cavity Equivalent Uniform Dose (EUD) calculated with n = 0.05 (panel (c)). Observed complication rates (solid circles) and the predicted complication probability curve (continuous line) are plotted. The dotted lines identify the 68% confidence intervals for the predicted curve. Calibration plots for the predictive models for grade ≥ 2 acute salivary dysfunction: for the model including combined parotid glands D98% (panel (b)) and for the model including oral cavity EUD (panel (d)). The solid lines represent the calibration graphs of the models and the black points are the observed complication rates together with their standard deviation. The dashed line represents the identity line. The calibration equation together with the corresponding R2 are presented on the calibration plots.

