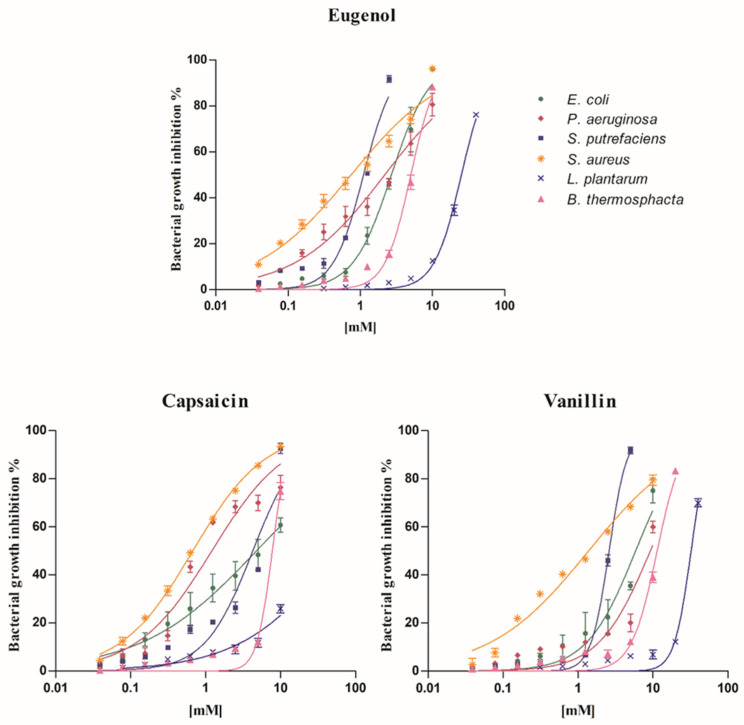
Figure 1.
Concentration/response curves. Concentration/response curves of eugenol, capsaicin, and vanillin on E. coli, P. aeruginosa, S. putrefaciens, S. aureus, L. plantarum, and B. thermosphacta in the microbial susceptibility test. The trends are from the interpolation of three independent experiments, using GraphPad Prism 5 ((GraphPad Inc., San Diego, CA, USA). The bars represent the standard deviation.

