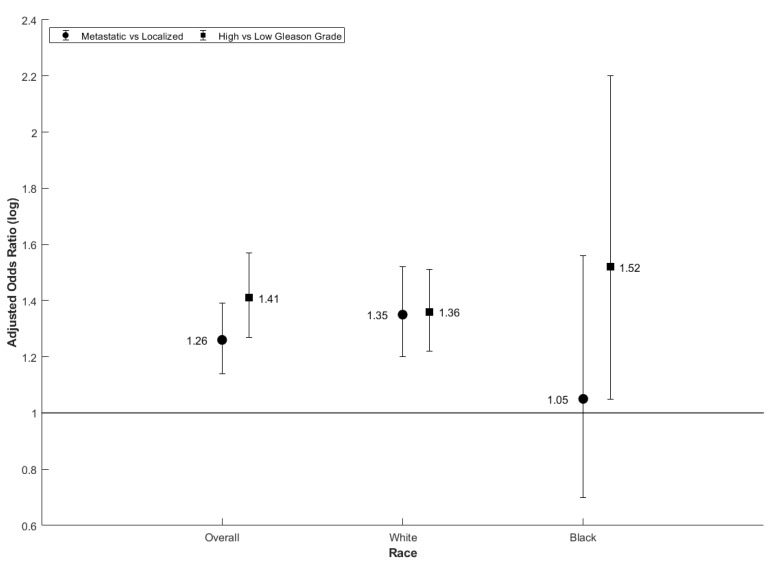
Figure 3.
Adjusted odds ratios for metastatic vs. localized and high vs. low Gleason grade prostate cancer for the 80th vs. 20th percentile of cadmium exposure concentration (OR, 95% CI) by race in RUCC 2 counties. Note: Adjusted odds ratios were adjusted for age at diagnosis, county-level sociodemographic index, county-level smoking prevalence, and county-level air quality index.

