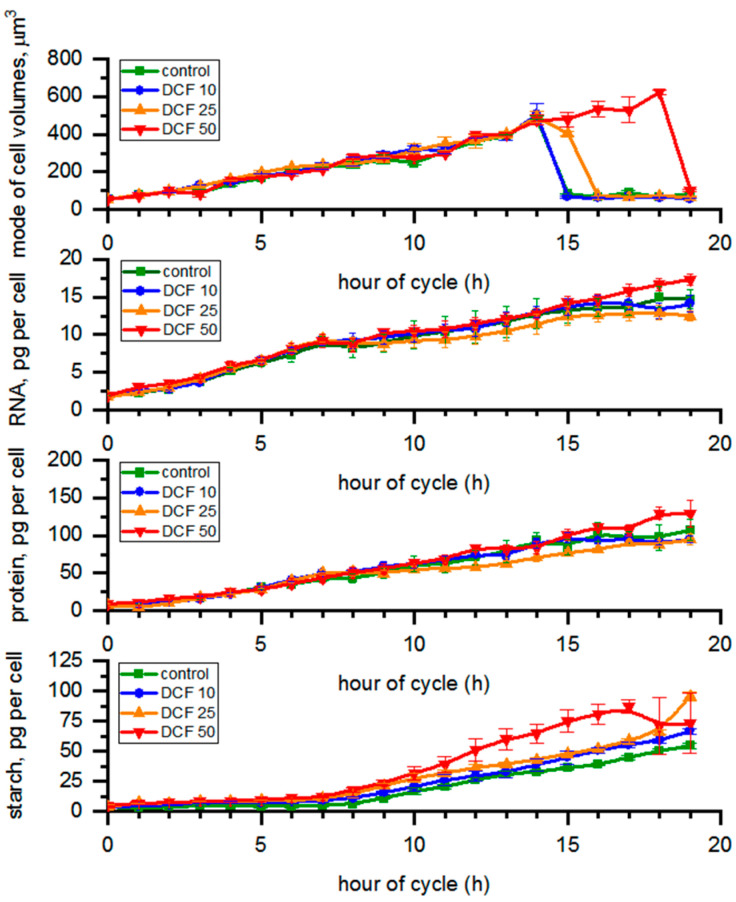
Figure 1.
Cell volume, RNA, protein, and starch content calculated per single mother cell. Data are presented as means ± SE. The mode cell volume and starch content of DCF50 were statistically significantly different from controls (correlation comparison, p < 0.05, n = 3). Data are presented as pg per mother cells even at the time of cell division to allow simple comparison across the groups.

