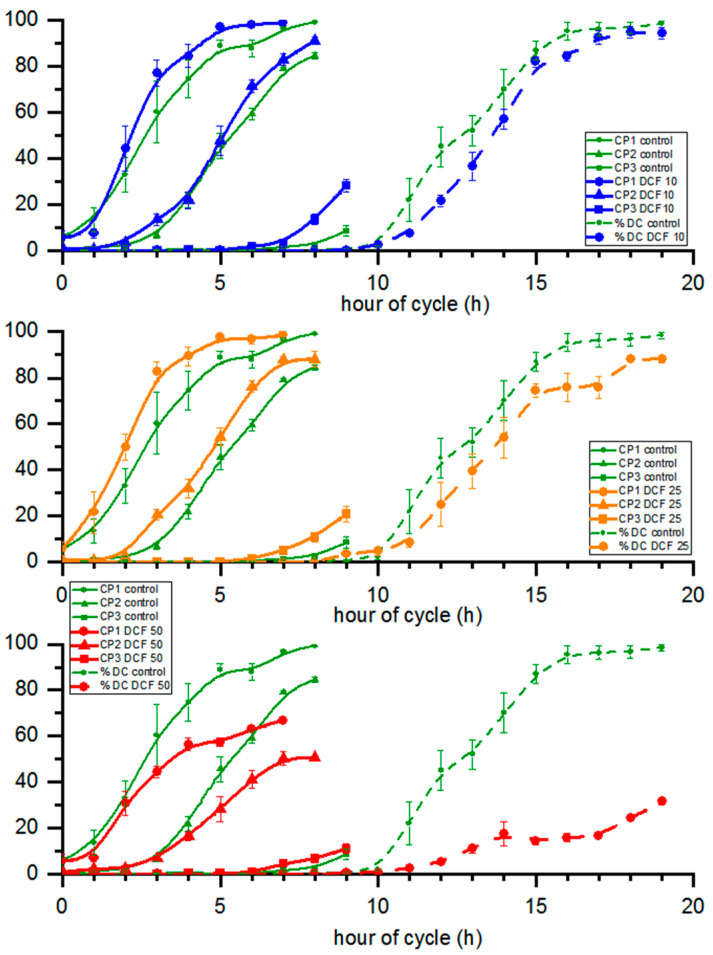
Figure 4.
The commitment points and percent of daughter cells of cultures. Data are presented as means ± SE. Attainment of CP1, CP2 and progression of cell division of DCF50 and attainment of CP3 of DCF10 were statistically significantly different from controls (Tukey’s HSD–Repeated Measures ANOVA, p < 0.05, n = 3).

