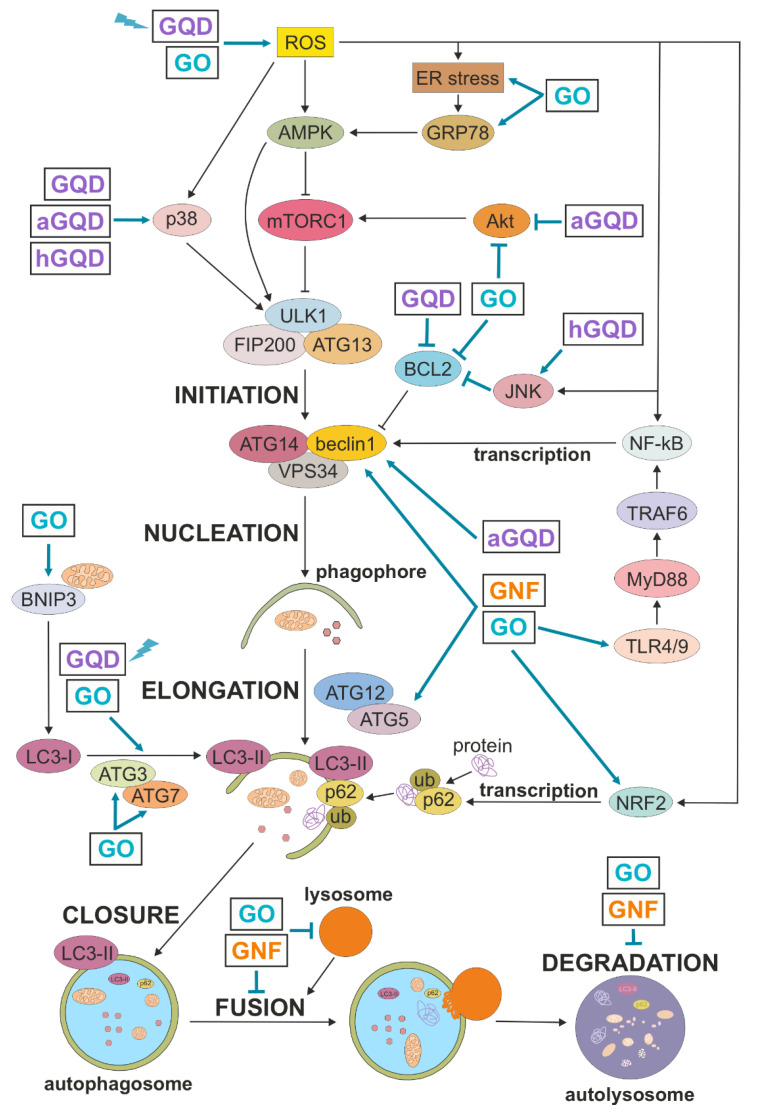
Figure 3.
Autophagy regulation and its modulation by GNM. A simplified map of autophagy regulation is presented, including the sites of action of GNM shown as arrow-headed (activation/increase) or bar-headed lines (inhibition/decrease). GQD and GO are shown to directly modulate LC3 conversion because no specific underlying mechanism is described. The presented interactions are described in more detail in the main text. aGQD, amino-GQD; AMPK, AMP-activated protein kinase; ATG, autophagy-related; BCL2, B cell lymphoma 2; BNIP3, BCL2-interacting protein 3; ER, endoplasmic reticulum; FIP200, focal adhesion kinase family interacting protein of 200 kD; GNF, graphene nanofibers; GO, graphene oxide; GQD, graphene quantum dots; GRP78, glucose-regulated protein 78; hGQD, hydroxy-GQD; JNK, c-Jun N-terminal kinase; LC3, microtubule-associated light chain 3; NF-κB, nuclear factor-κB; NRF2, nuclear factor erythroid 2-related factor 2; mTORC1, mechanistic target of rapamycin complex 1; MyD88, myeloid differentiation factor 88; ROS, reactive oxygen species; TLR, Toll-like receptor; TRAF6, TNF receptor associated factor 6; ub, ubiquitin; ULK1, Unc-51-like kinase 1; VPS34, vacuolar protein sorting 34; lightning symbol denotes photoexcitation.

