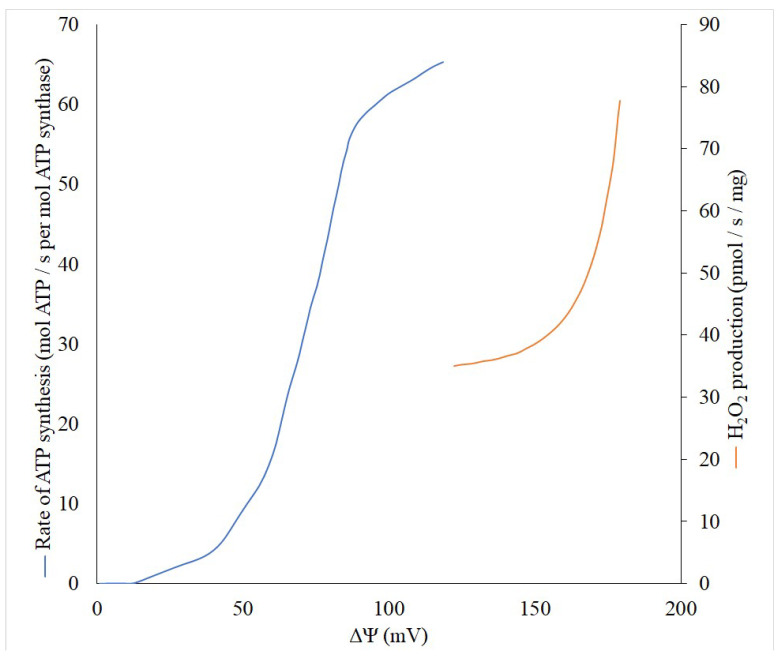
Figure 1.
Dependence of the generation of ROS (red) and ATP (blue) on the values of the membrane potential (∆Ψ). ROS generation was measured on isolated rat brain mitochondria with α-ketoglutarate as a substrate (from [30], with modifications). Differences in membrane potential were generated by adding various concentrations of FCCP ranging from 0 to 80 nM. ATP generated was measured using reconstituted E.coli ATP synthase. K+/valinomycin diffusion potentials were applied in the presence of ΔpH (from [34] with modifications).

