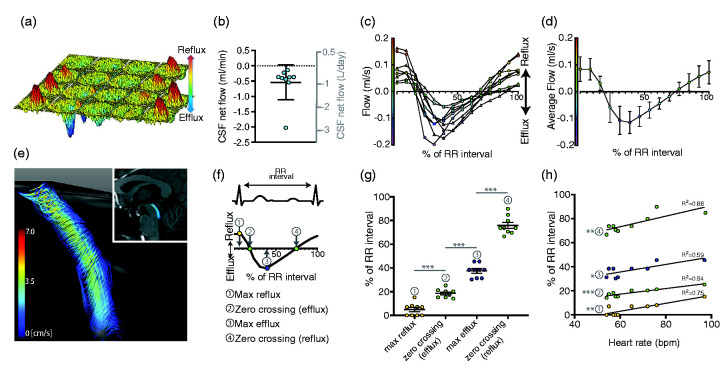
Figure 2.
CSF movement in the cerebral aqueduct is driven by the cardiac cycle. CSF flow in the cerebral aqueduct was measured with 7 T MR synchronized to the cardiac cycle with the temporal axis starting at the R-wave (onset of systole). (a) Representative surface plot of the pulsatile, in-and-out flow of CSF in the aqueduct. Reflux and efflux refer to flow of CSF towards the 3rd and 4th ventricle, respectively. (b) Net CSF flow ranged from –0.14 to –2.02 ml/min, or –200 to –2910ml/day, minus indicating efflux (n = 9). (c) CSF flow in the aqueduct from nine healthy subjects across a heart cycle normalized to 60 bpm, measured with 7 T MR. (d) Average CSF flow data for nine healthy subjects. Error bars show standard deviation. (e) 4 D flow review reconstruction of the CSF flow patterns in the cerebral aqueduct, extending from the base of the 3rd ventricle to the 4th ventricle, shown superimposed on the sagittal view of the brain. (f) The time points along the RR interval for (g) and (h), corresponding to peak reflux (1), zero crossing (2), the time of peak efflux (3) and zero crossing (4). (g) The temporal distribution of characteristics of the flow curve corresponds to specific phases of the cardiac cycle. ***p < 0.001, 2-way ANOVA. (h) Timing of events in relation to RR-interval correlates moderately (two later events, 3 and 4) and strongly (two early events, 1 and 2) with the heart rate. *p < 0.05, **p < 0.01, ***p < 0.001, Pearson Correlation. Previously unpublished data.

