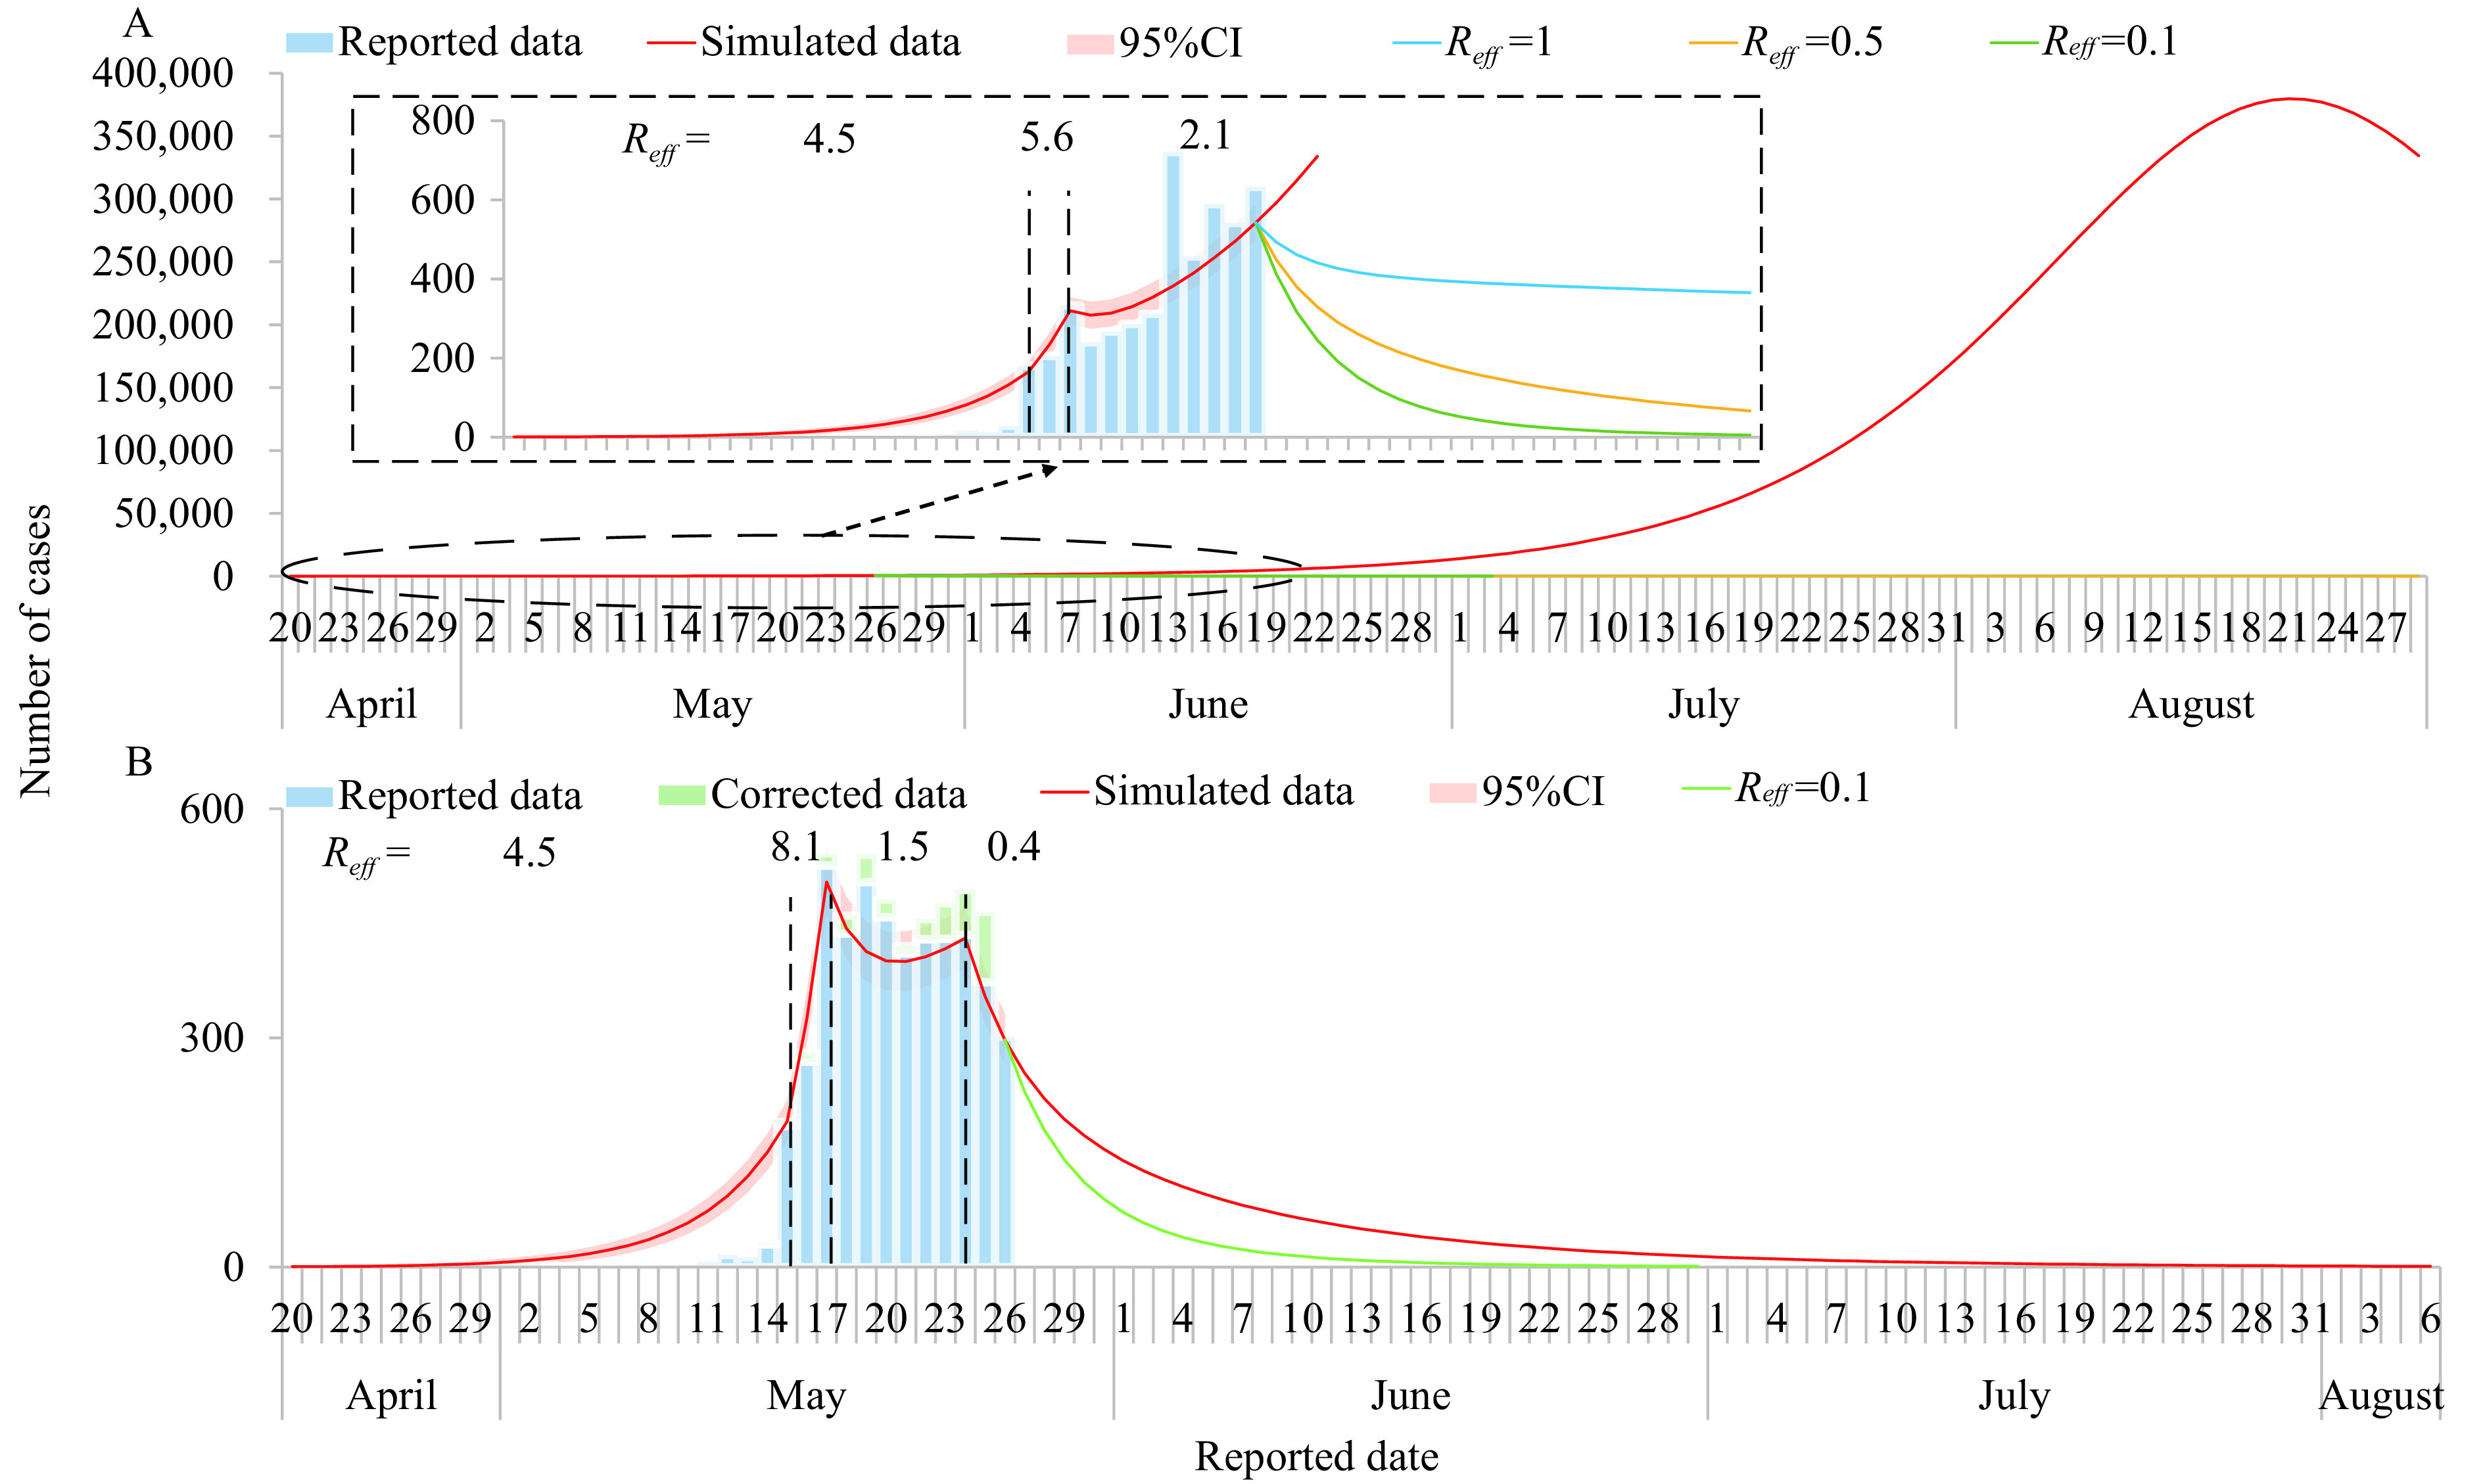
Figure 2.

The simulation results of epidemic trends based on the different value of Reff in Taiwan, China, 2021, according to two types of report data. (A) Scenario I; (B) Scenario II.
Note: In scenario I, the daily reported data was directly simulated in the model, and the curve was divided into 3 segments (from April 20 to May 15, from May 15 to May 17, from May 17 to May 26) based on the heterogeneity of the epidemic trends and the best goodness-of-fit of the model. We modeled the data according to trends from May 17 to May 26 and estimated the effects of interventions after May 26 by setting Reff to 1, 0.5, and 0.1. In scenario II, the daily reported data after adjustment was simulated in the model, the calibration of curve was divided into four segments (from April 20 to May 15, from May 15 to May 17, from May 17 to May 24, from May 24 to May 26) according to the heterogeneity of the epidemic trends and the best goodness-of-fit of the model. We predicted the data according to the trend from May 24 to May 26, and performed intervention after May 26 when setting Reff to 0.1.
