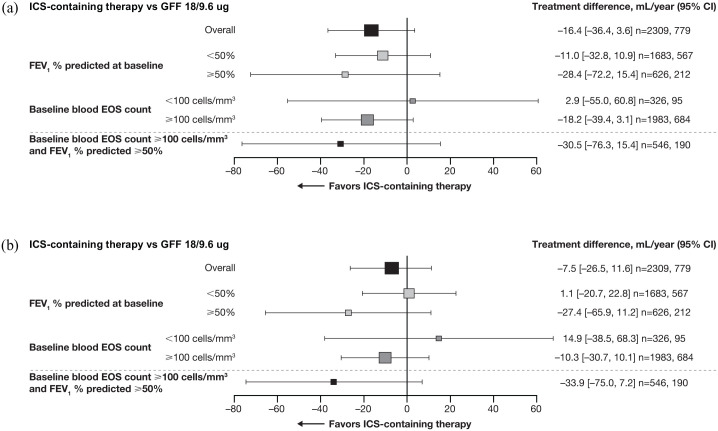
Figure 4.
Adjusted rate of decline in pre-dose trough FEV1 (a) and FEV1 AUC0–4 (b) over 52 weeks.
Size of data point relative to size of patient cohort; n are for ICS-containing therapies and GFF 18/9.6 ug, respectively.
AUC0–4, area under the curve 0 to 4 hours post-dose; CI, confidence interval; EOS, eosinophil; FEV1, forced expiratory volume in 1 second; GFF, glycopyrrolate/formoterol fumarate; ICS, inhaled corticosteroid.

