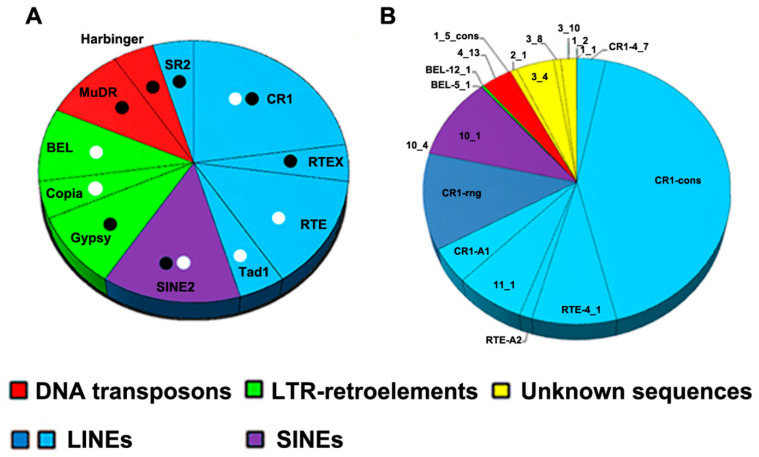
Figure 4.
Distribution of TE families among SAFLP cloned bands from H. elongata (A), and TPM (transcripts per million) values for transcripts corresponding to cloned fragments (B). Similar sequences were merged into consensus sequences where possible (CR1-cons is constructed from CR1-B1, CR1-B2, and CR1-B3; 1_5_cons is composed of 1_5 and 2_5 fragments). Black dots indicate the sequences cloned from conserved SAFLP bands, and white dots indicate those from variable bands. Red—DNA TEs; green—LTR elements; light blue—LINEs (RTs containing LINE-like fragments); dark blue—LINE-like fragments containing CR1-rng; violet—SINE; yellow—non-annotated sequences.

