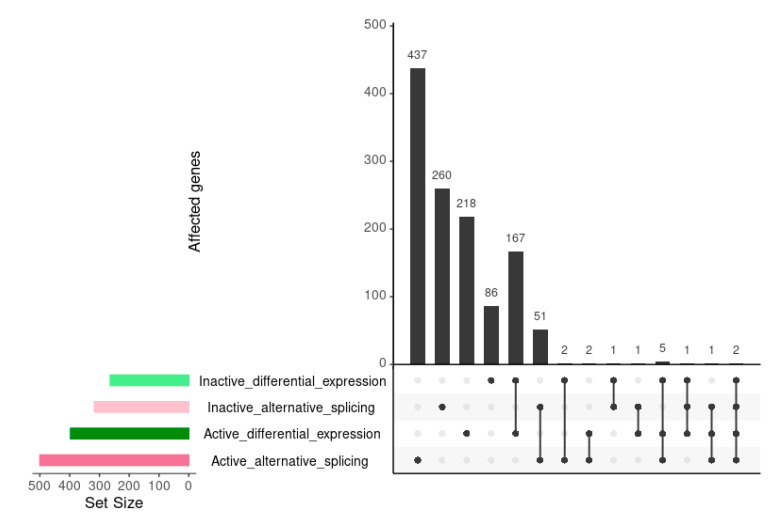
Figure 2.
Upset comparison of genes affected by differential expression and alternative splicing in the inactive vs. healthy and the active vs. healthy comparisons. Horizontal bars show the number of genes belonging in each of the compared sets. Connected dots in the grid correspond to the combination of sets. Vertical bars show the number of genes shared among the sets in each combination.

