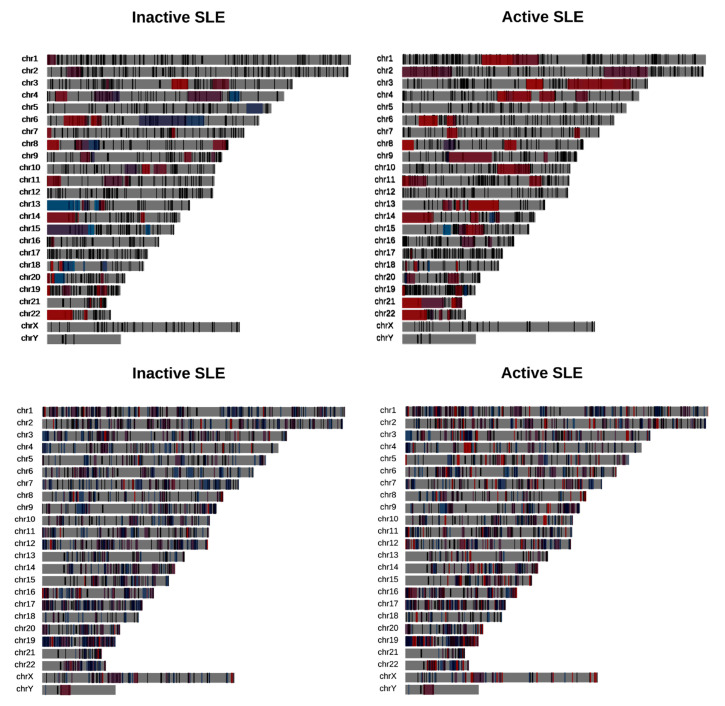
Figure 5.
Overlaps between DFD (top) and DCE (bottom) and genes affected by AS in inactive (left) and active (right) SLE patient samples. Top: DFD color denotes down (blue) or upregulation (red). Bottom: DCE color denotes the DCE dynamics. Blue (contracted, depleted or split DCE), red (intact, merged or expanded DCE).

