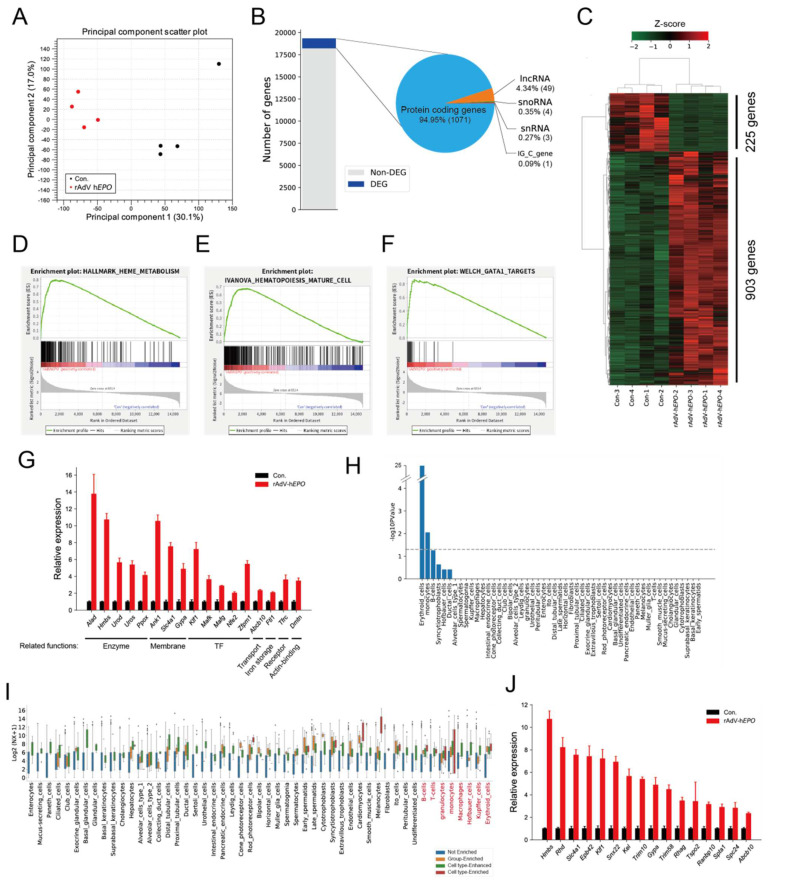
Figure 3.
Hematopoietic changes caused by rAdV-hEPO supporting the whole-blood RNA-seq findings. (A) PCA plot showing similarities between samples. (B) Bar plot and pie chart showing the 1128 DEGs included among all detected genes in whole blood and rates of the gene types. (C) Heat map indicating the DEG profile. Values in the rows are z-scores. GSEA showing enriched terms: heme metabolism (D), hematopoiesis mature cell (E), and GATA1 target (F) terms. (G) Relative gene expression levels (Con. = 1.0) showing gene expression in the GATA1 target term in (F). Biological-related functions are described under gene names. The genes were visualized according to the GSEA enrichment results with a “Yes” value. Error bars indicate the standard error of the mean (SEM). (H) Bar plot showing the CTSA to predict cell-type-specific enrichment in DEGs. The gray line represents a significant threshold (p < 0.05). (I) Box plot showing single-cell gene normalized expression (“NX”) of DEGs in each cell type. Single-cell gene expression levels of DEGs were classified by cell-type-specific definitions by TissueEnrich for each cell-type. (J) Relative gene expression levels (Con. = 1.0) showing erythroid cell-enriched gene expressions in DEGs. Abbreviations: long non-coding RNA (lncRNA), small nucleolar RNA (snoRNA), small nuclear RNA (snRNA), and immunoglobulin constant germline gene (IGC gene).

