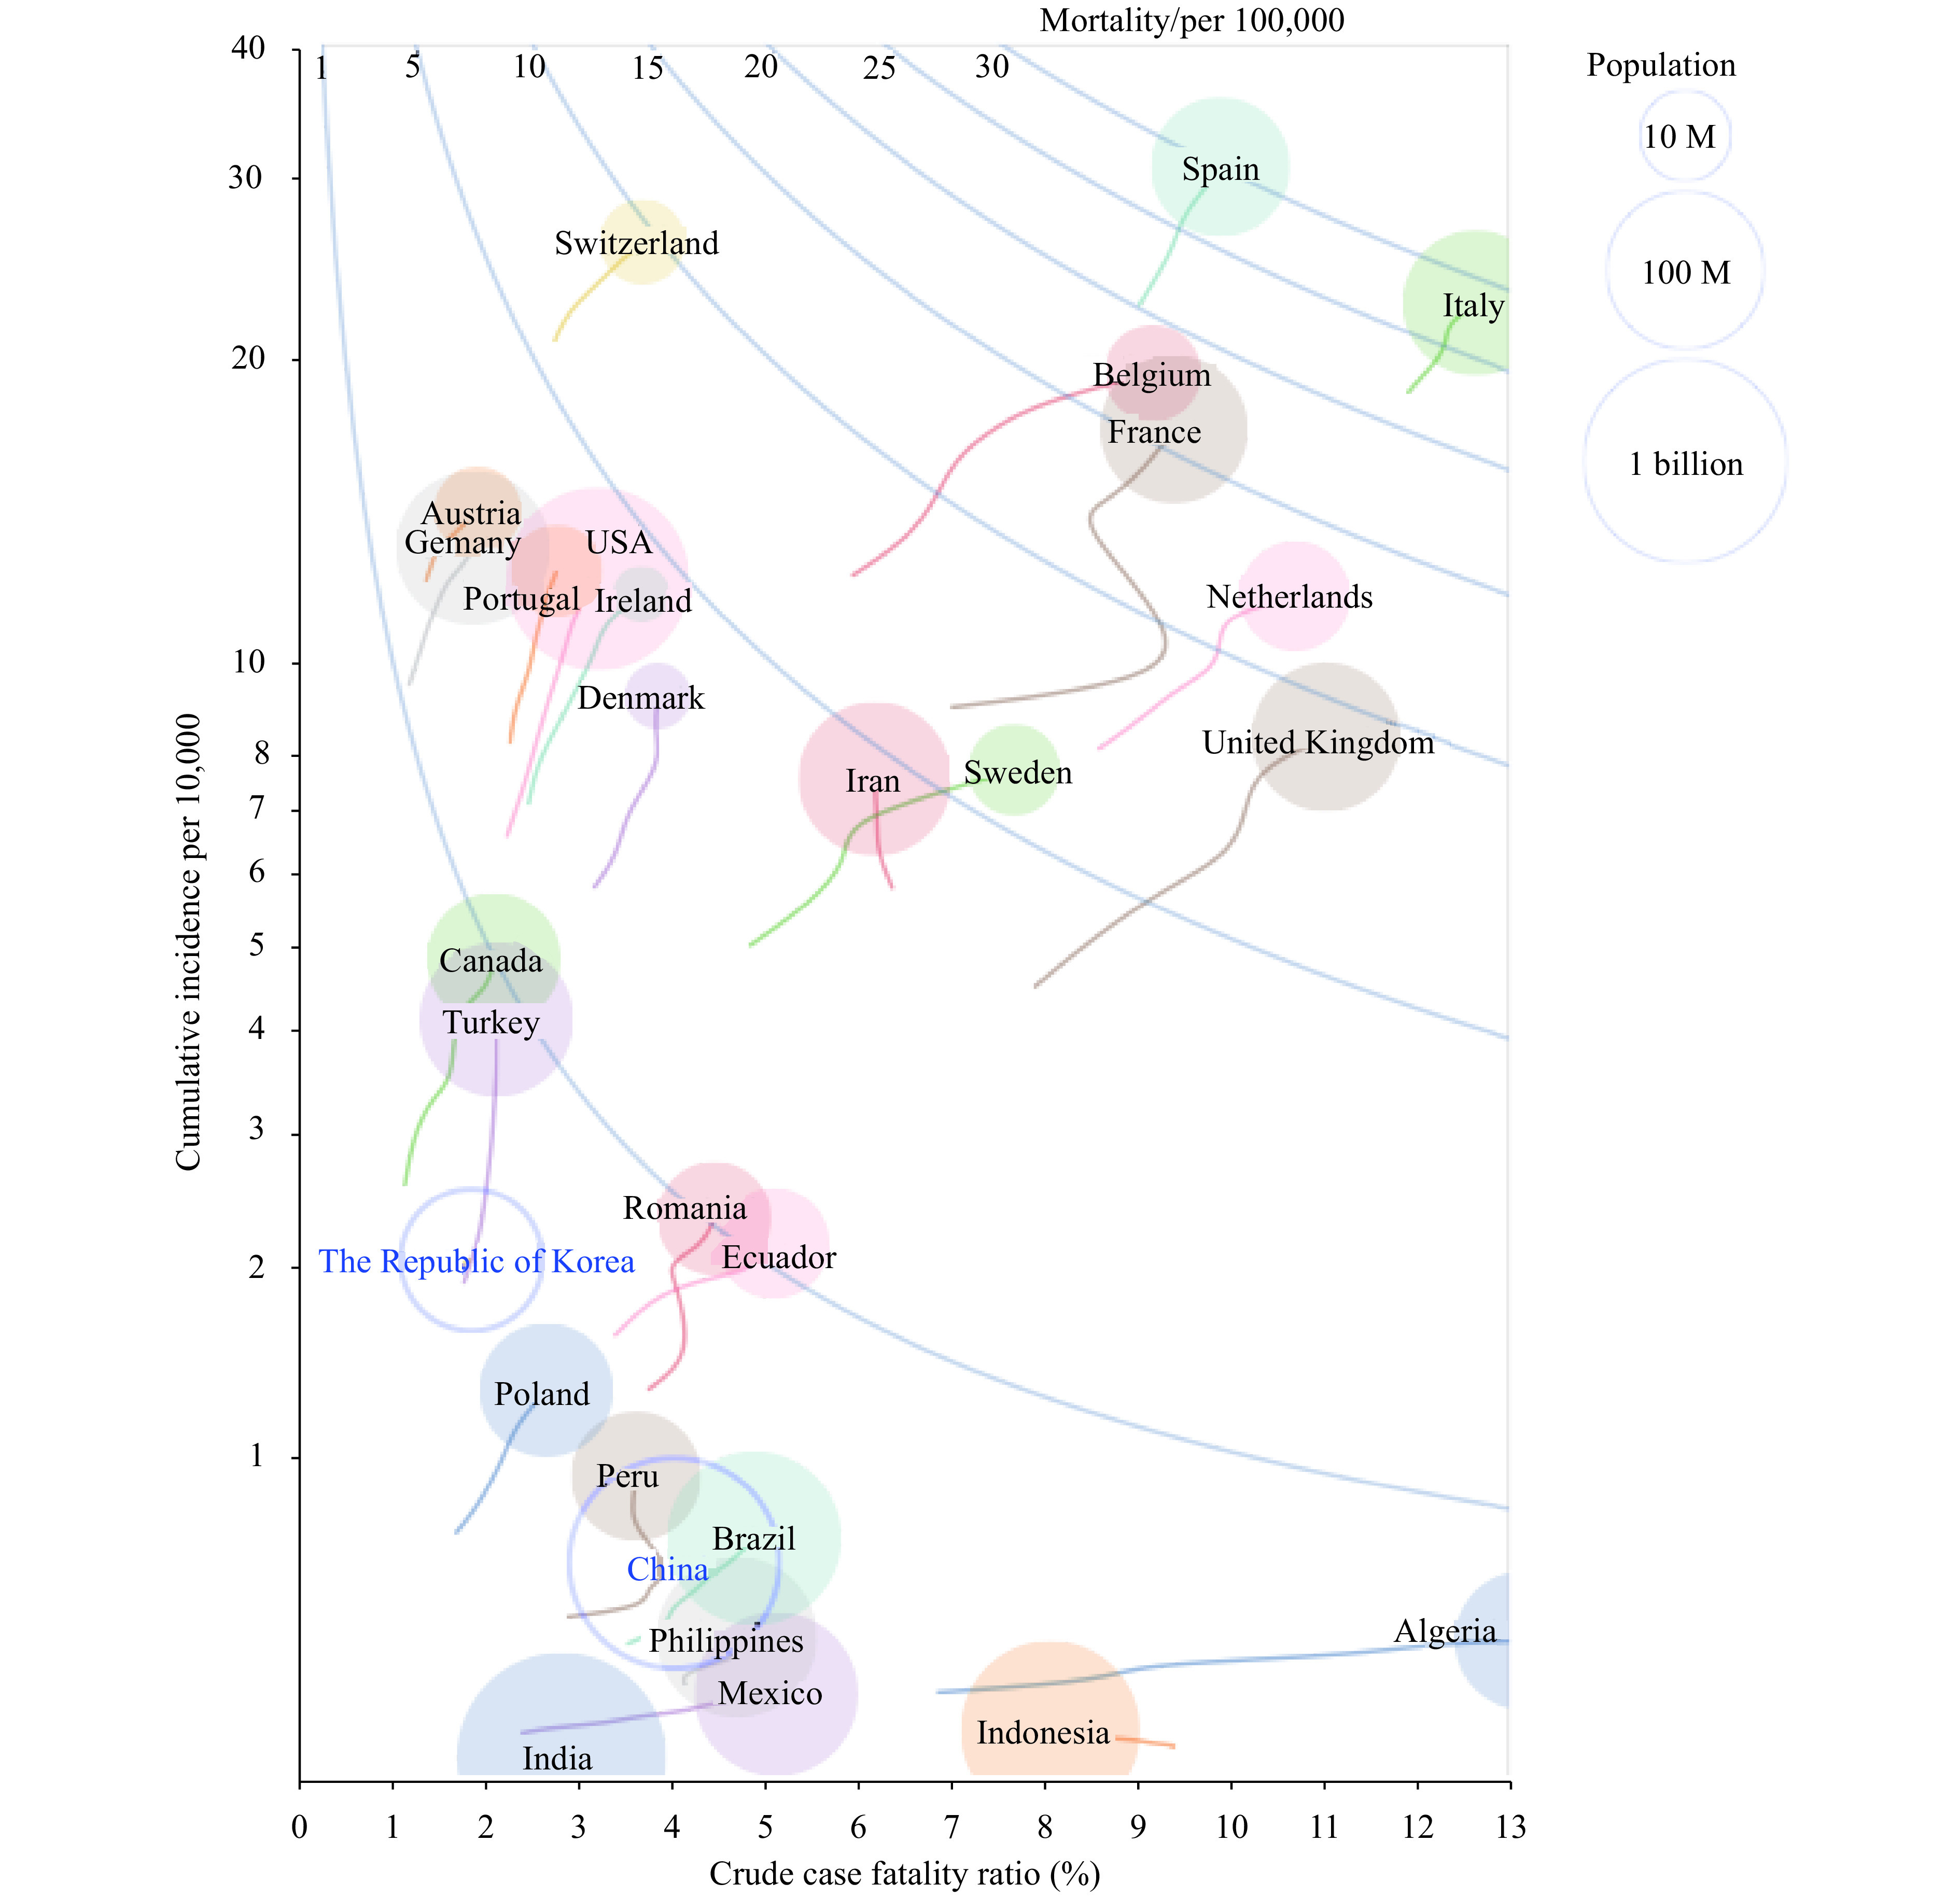
Figure 1.

Comparisons of the COVID-19 crude case fatality ratio (X axis = total deaths/total cases), cumulative incidence (Y axis = total cases/total population), and mortality (the isoline = total deaths/total population) of 29 countries with more than 100 fatal cases by April 8, 2020. The size of the balloon was proportional to the country's population size. The small rope of the balloon traced the history of changes related to CI and CFR in the past 7 days. M=million.
