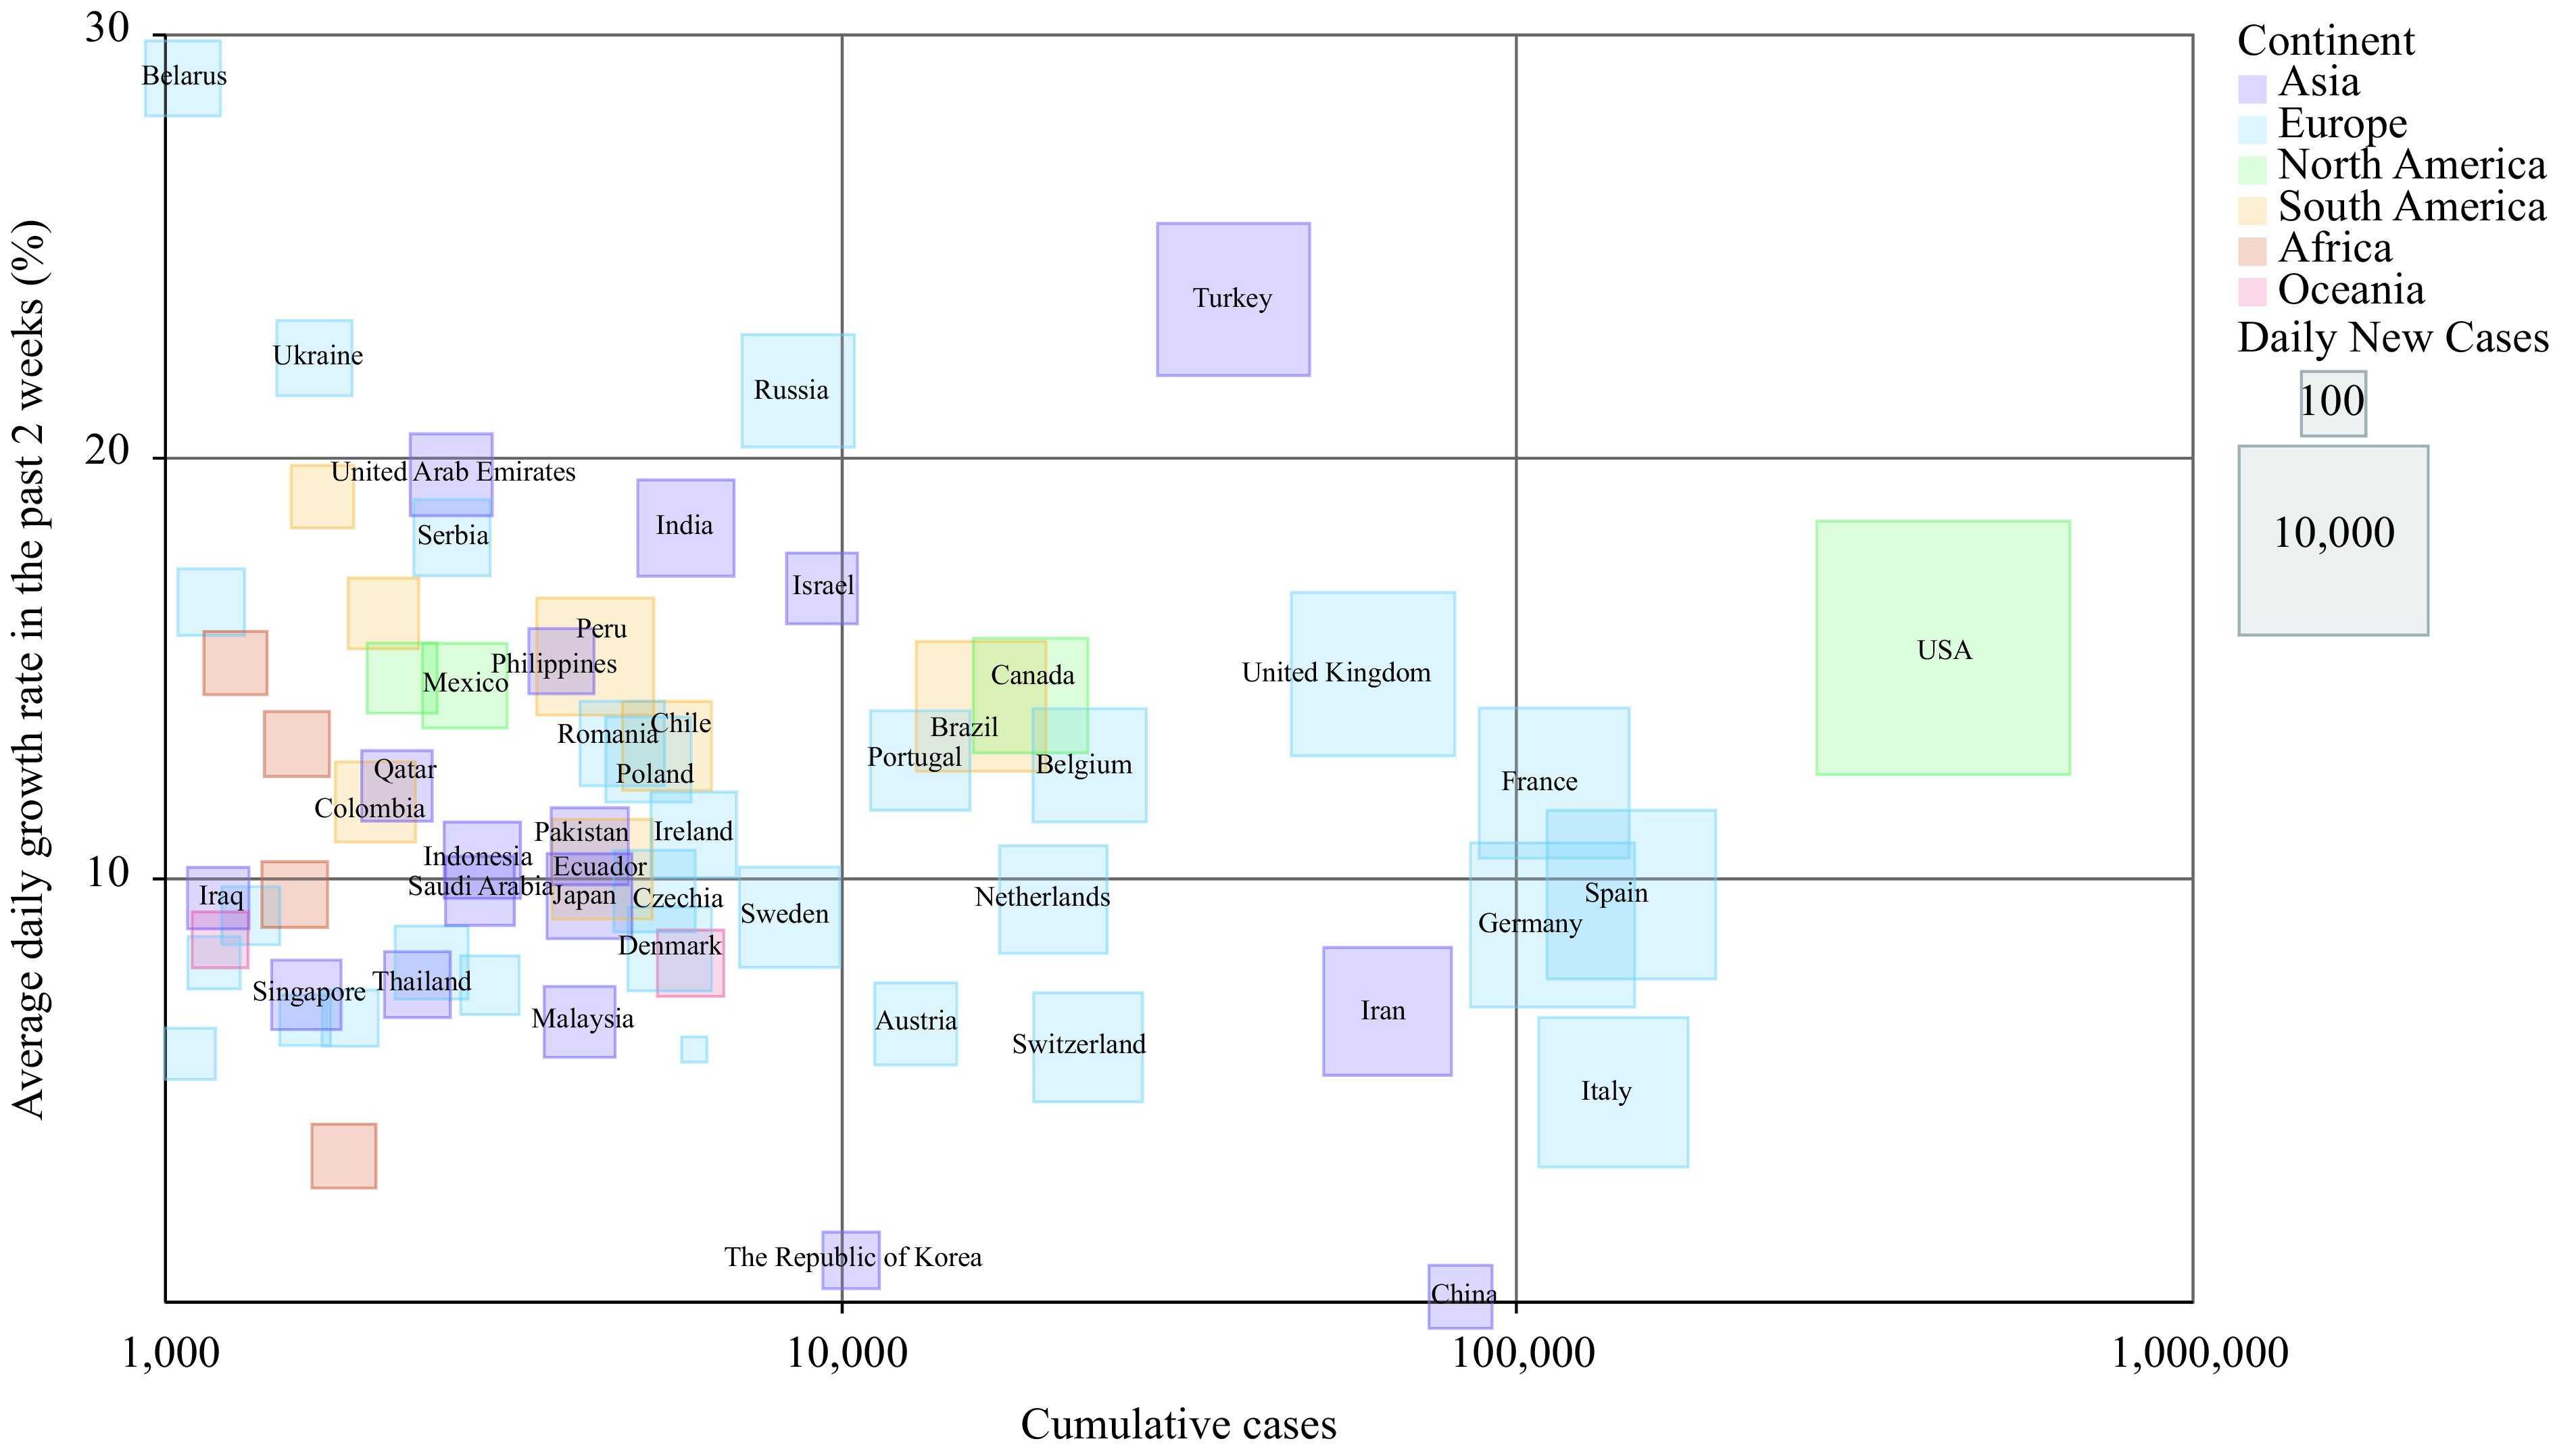
Figure 2.

The average daily growth rate of the reported cumulative cases in the past two weeks for each affected country with more than 1,000 total confirmed cases by April 7. The color represented the continent. The size of the square was proportional to the number of new cases on April 7.
