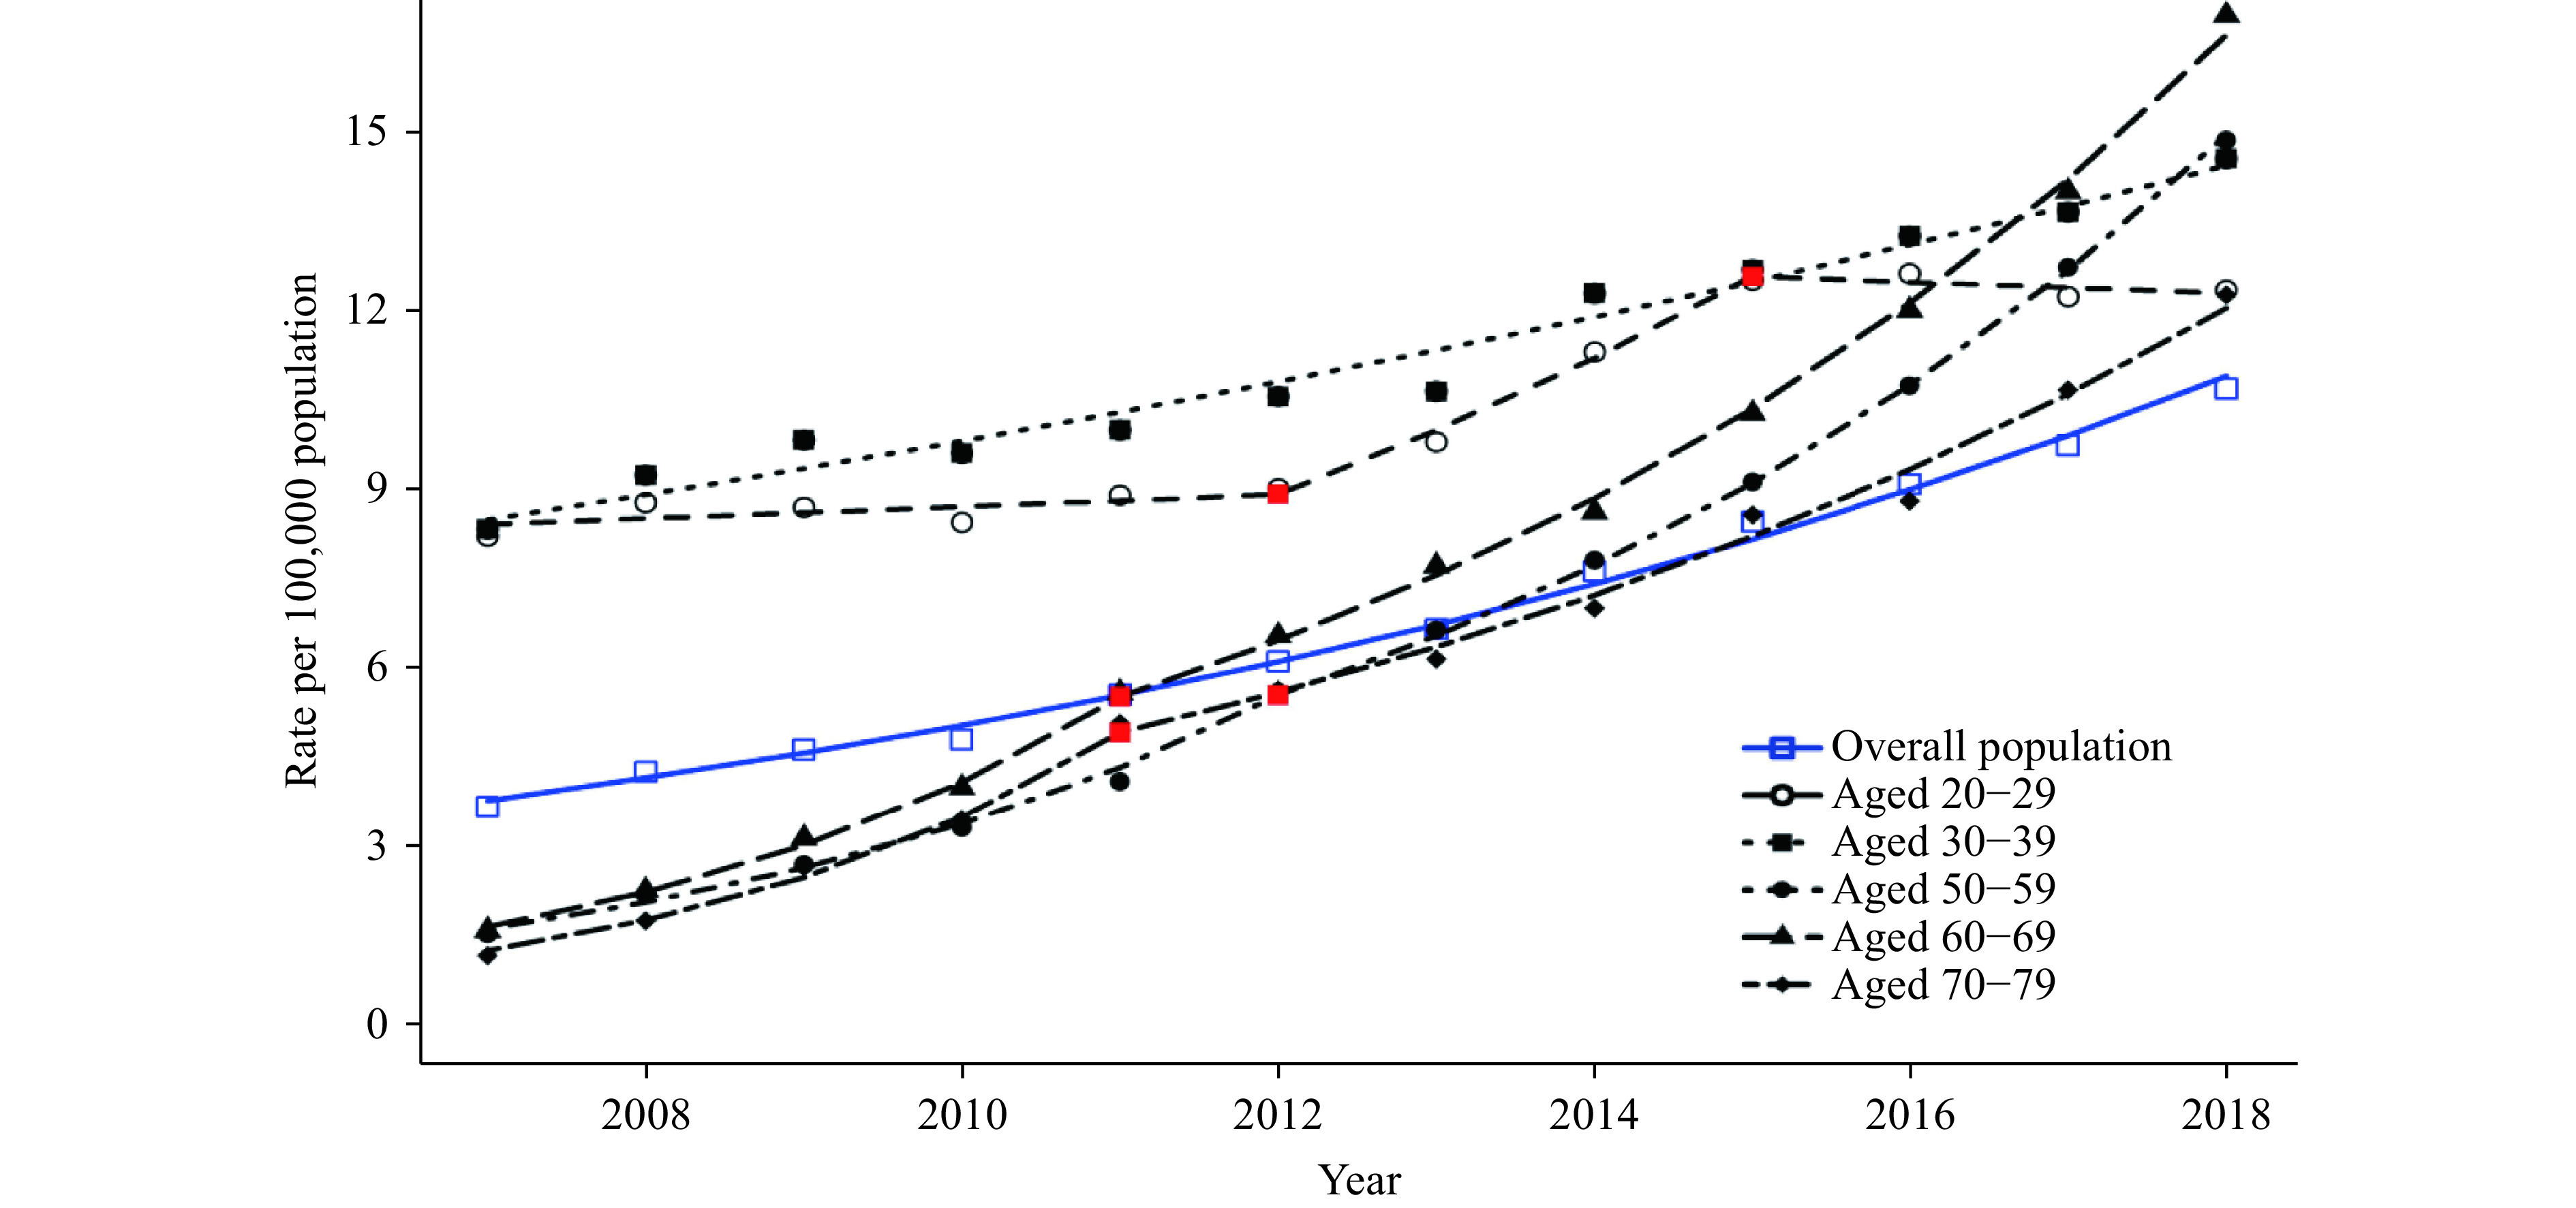
Figure 1.

Observed and modeled rates of newly diagnosed HIV/AIDS among all population by specific age groups — China, 2007–2018.
Note: Joinpoint regression analysis was used to determine annual percentage change (APC) with statistically significant trends and significant joinpoints. The red points in the figure show the positions of jointpoints for each age group. Rates are single-year rates per 100,000 population.
