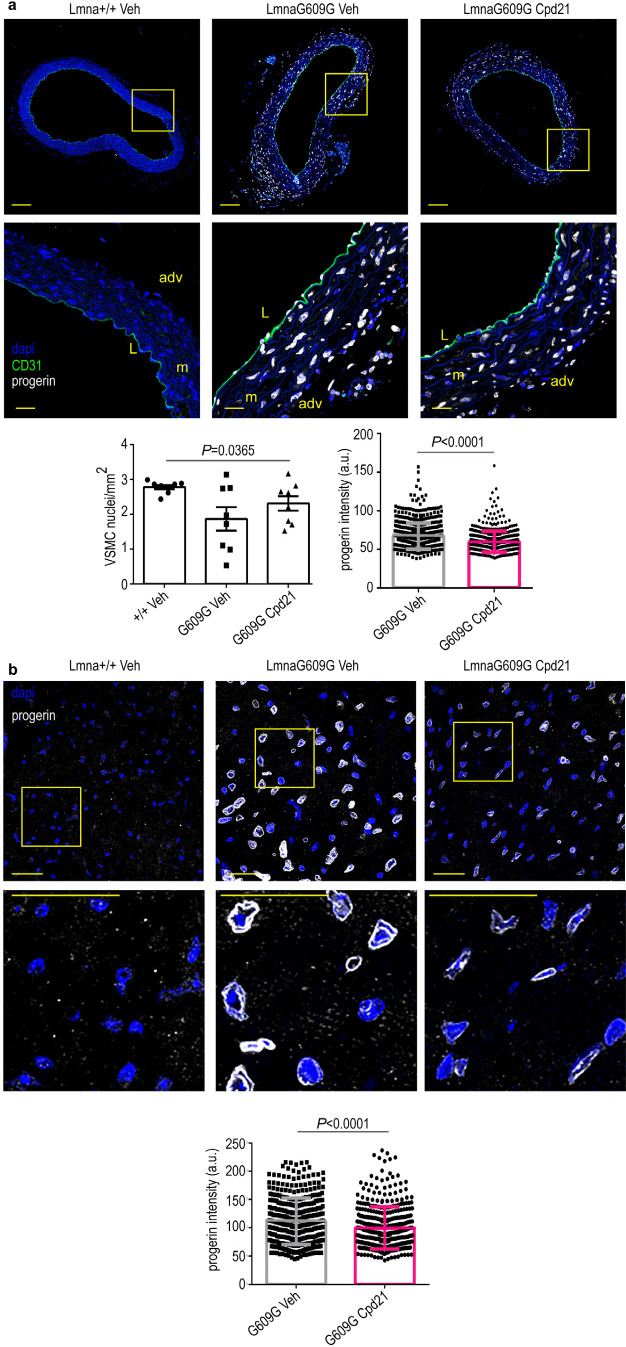
Figure 4.
Reduced progerin expression in progeric LmnaG609G/G609G mice treated with compound 21. Mice of the indicated genotypes were treated with compound 21 or vehicle, starting at 6 weeks of age, and were sacrificed at 12 weeks of age. Cross sections of aortic arch and heart were stained with antiprogerin antibody (white) and Hoechst 33342 to visualize nuclei (blue). Representative immunofluorescence images are shown. (a) Aortic arch. Scale bar: 100 μm (entire image) and 20 μm (magnified view). L, lumen; m, media; adv, adventitia. The left plot shows mean ± sem number of VSMCs in the medial layer of the aortic arch (n = 4 animal per condition, 2 sections per animal). The right plot shows mean ± desvest of progerin signal intensity in VSMC from the medial layer of the aortic arch (n = 646 nuclei for LmnaG609G/G609G treated with vehicle and 532 nuclei for LmnaG609G/G609G treated with compound 21, from 4 animals per condition, two-tailed Student′s t test). (b) Endocardial tissue. The bottom plot shows mean ± desvest of progerin signal intensity (n = 400 nuclei for LmnaG609G/G609G treated with vehicle and 412 nuclei for LmnaG609G/G609G treated with compound 21, from 5 animals per condition, two-tailed Student′s t test). Scale bar: 25 μm.

