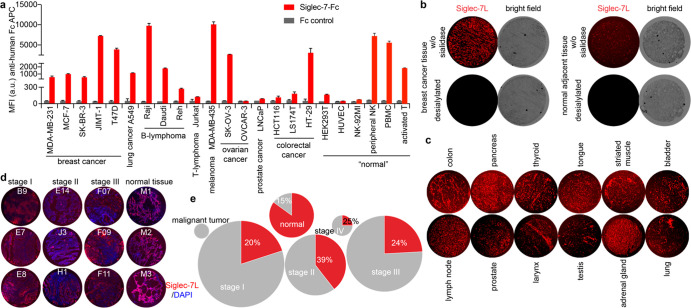
Figure 1.
Profile of Siglec-7 ligand (Sigle-7L) expression on the cell surface of live cells and human tissue specimens. (a) Cell lines and primary immune cells from healthy human donors were stained with recombinant Siglec-7-Fc precomplexed with an anti-human Fc-APC antibody, and anti-human Fc-APC only was used to assess the ligand-binding specificity (Fc control). Error bar represents the standard deviation of three biological samples. (b) Probing the Siglec-7L expression in human breast cancer tissues and the normal adjacent tissues that were pretreated with neuraminidase to remove sialic acids or not. (c) Probing the Siglec-7L expression in different human malignant tissues. (d, e) Probing the Siglec-7L expression in lung cancer tissues and adjacent normal tissues from different donors (total of 197 samples). The lung malignant tumor samples (n = 2), stage I lung malignant (n = 75), stage II lung malignant (n = 38), stage III lung malignant (n = 58), stage IV lung malignant (n = 4), and normal lung tissue (n = 20) were used for Siglec-7L screening. Three representative Siglec-7L-high samples were shown (d). Siglec-7L levels were classified based on Siglec-7-Fc staining mean fluorescence intensity (MFI) that was determined via ImageJ with a cutoff value of MFI = 27.00. The sample size in each group was plotted using a pie chart, and the areas in each circle are equal to the sizes of each group (e), Siglec-7 low (gray) and high (red). The percentages of Siglec-7L high specimens were shown in the figure.

