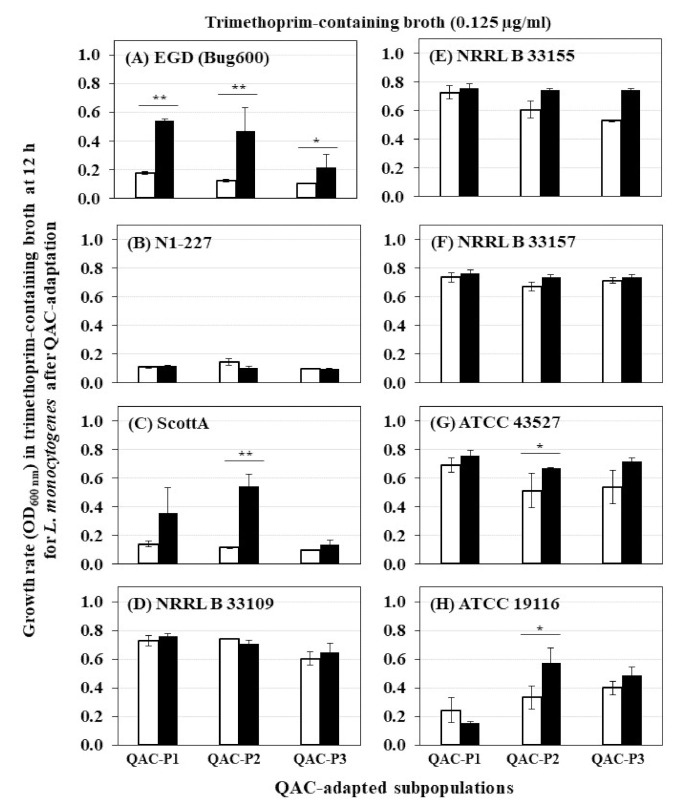
Figure 3.
Changes in growth rate at 12 h (OD600) in trimethoprim-containing broth of QAC-adapted subpopulations (closed bars) compared to non-adapted control (open bars) cells of eight L. monocytogenes at 37 °C: (A) EGD (Bug600), (B) N1-227, (C) ScottA, (D) NRRL B 33109, (E) NRRL B 33155, (F) NRRL B 33157, (G) ATCC 43527, (H) ATCC 19116. Error bars indicate standard errors of means. Statistically significant P values are indicated by asterisks (*, p < 0.05; **, p < 0.01) that were obtained using the unpaired two-tailed t-test.

