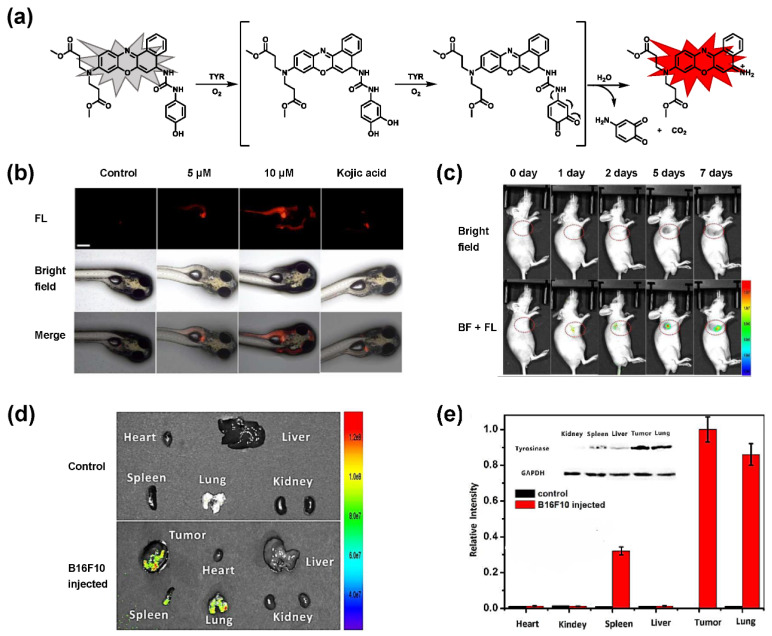
Figure 9.
(a) The schematic diagram of NBR-AP for TYR detection. (b) Images for 3-day-old zebrafish incubated with various concentrations of the probe and kojic acid. (c) Fluorescent and bright field images of 4-week-old mice injected with the probe upon injection with B16F10 cells. (d) Images of dissected organs of the mice injected with the probe upon injection with B16F10 cells for 14 days. (e) Relative intensity values (n = 3) obtained from (d) and calculated using Image J2x software, while the relative intensity from tumor is defined as 1.0 [88]. Copyright permission is granted by American Chemical Society.

