Table 3.
Fluorescent substrates of TYR.
| Names | Chemical Structures | λex/em (nm) |
Folds |
Km (μM) |
Vmax (μM·min−1) |
LOD (U·mL−1) |
Biological Applications |
Ref. |
|---|---|---|---|---|---|---|---|---|
| L3 |
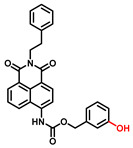
|
425/467 425/535 |
- | 43.5 | 1.87 | 0.2 | A375 cells | [81] |
| Probe 1 |
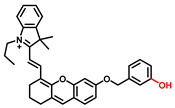
|
670/708 | - | 156 | 4.58 | 2.76 | B16 and HeLa cells, zebrafish | [82] |
| HB-NP |
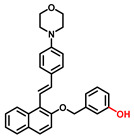
|
480/675 | 48 | 87.35 | 1.07 | 0.5 | B16, HepG2, A549, HeLa, CCC-HPF-1 and CCC-HSF-1 cells; inhibitor screening. | [80] |
| Probe 1 |
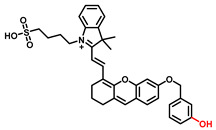
|
670/708 | - | - | - | 0.11 | Imaging of TYR in B16 cells and zebrafish, melanoma diagnosis in a mouse. | [83] |
| Probe 1 |

|
550/586 | - | 30 | 0.72 | 0.04 | B16, HepG2 and MCF-7 cells | [84] |
| Probe 1 |

|
550/583 | - | 6.5 | 0.0009 | 0.5 | B16 and HepG2 cells | [85] |
| NHU |

|
382/503 | 12 | - | - | - | B16-F1 and HeLa cells | [86] |
| Probe 1 |

|
460/540 | 12 | - | - | - | Screening inhibitors | [87] |
| NBR-AP |
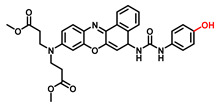
|
580/660 | 7 | 229.5 | 5.75 | - | Imaging of TYR in B16F10 and HeLa cells, in vivo imaging of zebrafish and mice | [88] |
| Mela-TYR |
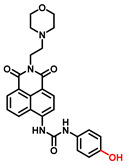
|
425/547 | 50 | - | - | 0.07 | B16 and HeLa cells, the subcellular localization | [89] |
| Cy-tyr |
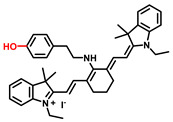
|
630/760 516/556 |
- | - | - | 0.02 | B16, HeLa, MCF-7 and HUVEC cells | [90] |
| Probe 1 |
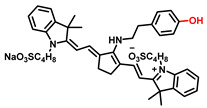
|
650/720 | - | - | - | 0.01 | Screening inhibitors | [91] |
| MB1 |
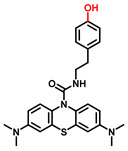
|
640/706 | >100 | 4.6 | 0.45 | - | B16F10 and HeLa cells, photodynamic therapy | [92] |
| Tyro-1 |
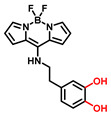
|
400/452 | 12.5 | - | - | 0.025 | B16F10 and HeLa cells | [93] |
| Probe 1 |
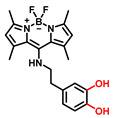
|
460/515 | - | 5.3 | 6.36 | - | B16F10 cells | [94] |
| CHMC-DOPA |
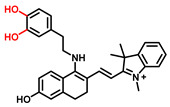
|
538/629 | - | - | - | 0.003 | HepG2 cells, zebrafish | [95] |
