
Figure 2.
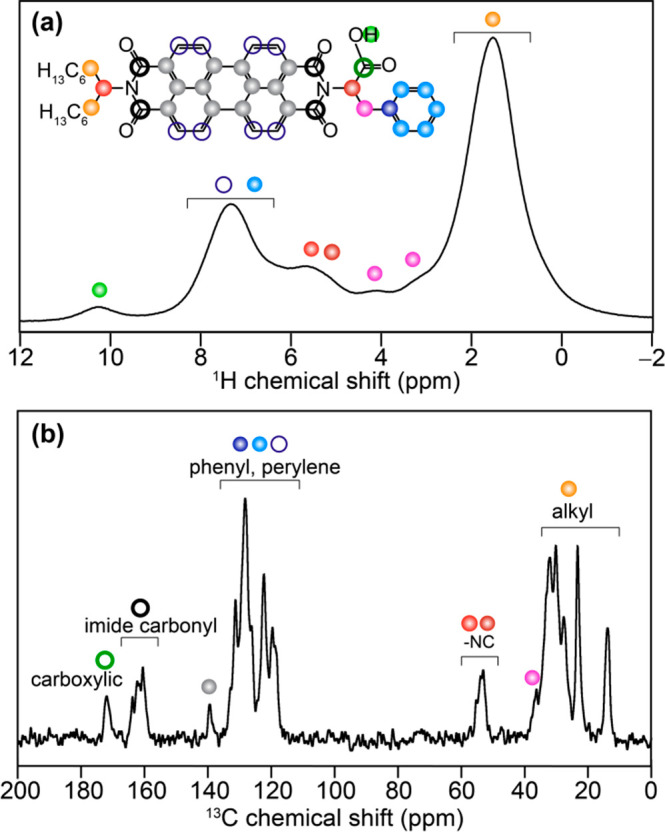
Solid-state 1D NMR spectra of solid PBI-1 aggregates acquired at 18.8 T (a) 1H MAS NMR (1H Larmor frequency = 800.1 MHz) recorded at 56 kHz MAS and (b) 13C CP-MAS NMR spectrum (13C Larmor frequency = 201.2 MHz) acquired at 50 kHz MAS using 2 ms CP contact time. 1H and 13C signals correspond to aliphatic and aromatic groups are colored as depicted in the inset to (a).