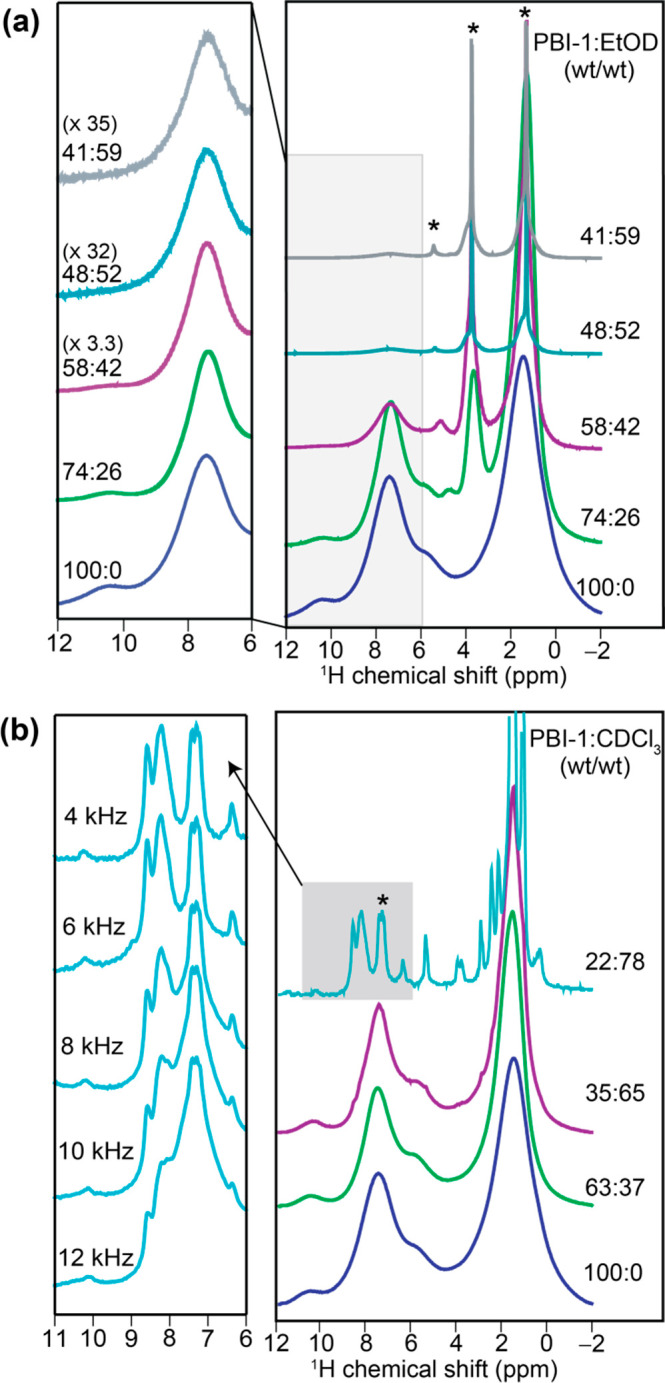
Figure 6.

1D 1H HR-MAS NMR spectra of solid PBI-1 aggregates acquired at 800.1 MHz as a function of good solvent. (a) Bottom-up stack plot of PBI-1:ethanol-d, wt/wt, 100:0 (blue), 74:26 (green), 58:42 (violet), 48:52 (cyan), and 41:59 (gray) acquired at 20, 20, 18, 12, and 8 kHz of MAS, respectively. Expanded region (left) depicts normalized intensities of aromatic 1H signals. (b) Bottom-up stack plot of PBI-1:CDCl3, wt/wt 100:0 (blue), 63:37 (green), 35:65 (violet) acquired at 20 kHz MAS, and 22:78 (cyan) acquired at 4 kHz MAS. The expanded region (left) depicts aromatic regions of 1H spectra 22:78 (cyan) acquired at different MAS frequencies varying from 4 to 12 kHz (Supporting Information, section 9). * denotes solvent peaks associated with (a) ethanol-d (EtOD) and (b) chloroform-d (CDCl3).
