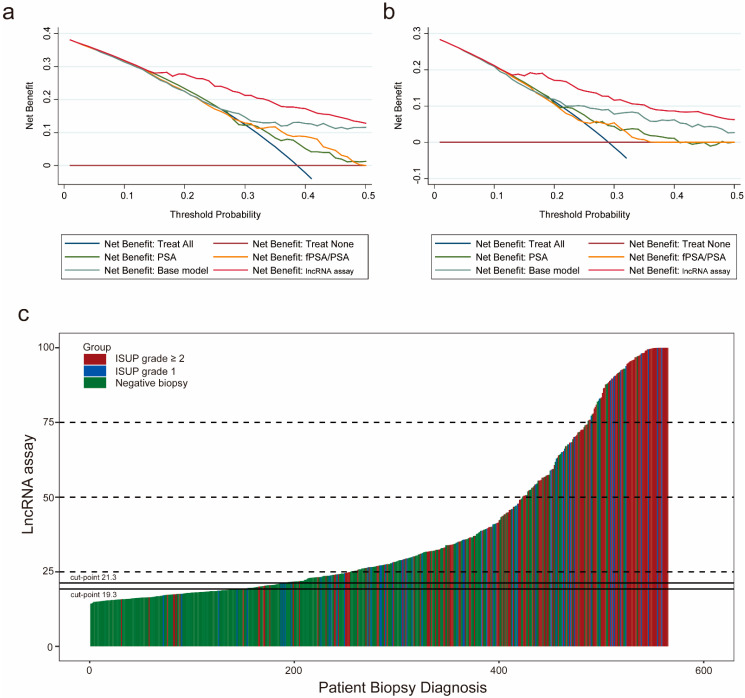
Figure 4.
Clinical utility of the lncRNA assay. The decision curve analysis shows that the lncRNA assay presents the highest net benefit across all threshold probabilities for diagnosing PCa (a) and high-grade PCa (b). The dark red horizontal line parallel to the x-axis represents no patient undergoing a biopsy (Treat None). The blue line indicates that all the patients will have PCa (Treat All). (c) Waterfall plot of the lncRNA assay scores in relation to the prostate biopsy results (n = 565). Each bar represents an individual. Red indicates the ISUP grade ≥ two tumors (GS ≥ 7); blue indicates the ISUP grade of one tumor (GS = 6); green indicates the negative biopsies. Two black horizontal lines represent the cutoff points of 21.3 at the sensitivity of 90% and 19.3 at the sensitivity of 95%. ISUP: International Society of Urological Pathology.

