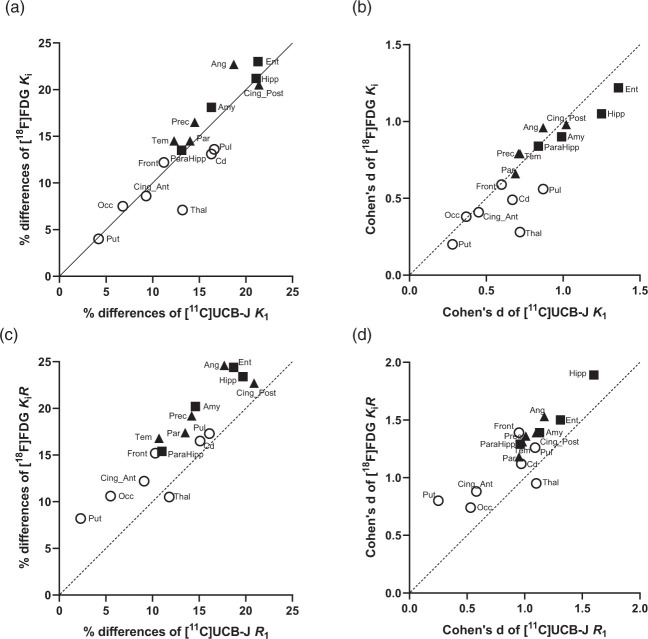
Figure 3.
Scatter plots of regional percentage differences between CN and AD (a, c) and Cohen’s d (b, d) for [11C]UCB-J (K1 and R1 on x-axis) versus [18F]FDG (Ki and KiR on y-axis). (a) Comparing [11C]UCB-J K1 and [18F]FDG Ki demonstrated very similar % differences in most examined regions including in medial temporal regions (■ Hipp, Ent, Amy, and ParaHipp), susceptible neocortical regions (▲Ang, Cing_Post, Prec, Tem, Par), and other examined regions (o), which appeared well aligned along the identity line. (b) There were similar Cohen’s d values of [11C]UCB-J K1 vs [18F]FDG Ki in most examined regions. (c) Comparing [11C]UCB-J R1 and [18F]FDG KiR demonstrated generally lower % differences of [11C]UCB-J R1 in the examined regions. (d) Overall, there were slightly lower Cohen’s d values of [11C]UCB-J R1 vs [18F]FDG KiR in the examined regions.
Amy: Amygdala; Ang: angular; CS: centrum semiovale; Cd: Caudate; Cing_Ant: Ant. Cingulate; Cing_Post: Post. Cingulate; Ent: Entorhinal; Front: Frontal; Hipp: Hippocampus; Occ: Occipital, ParaHipp: ParaHippocampus; Par: Parietal; Prec: Precuneus; Pul: Pulvinar; Put: Putamen; Tem: Temporal; Thal: Thalamus.

