Figure 4.

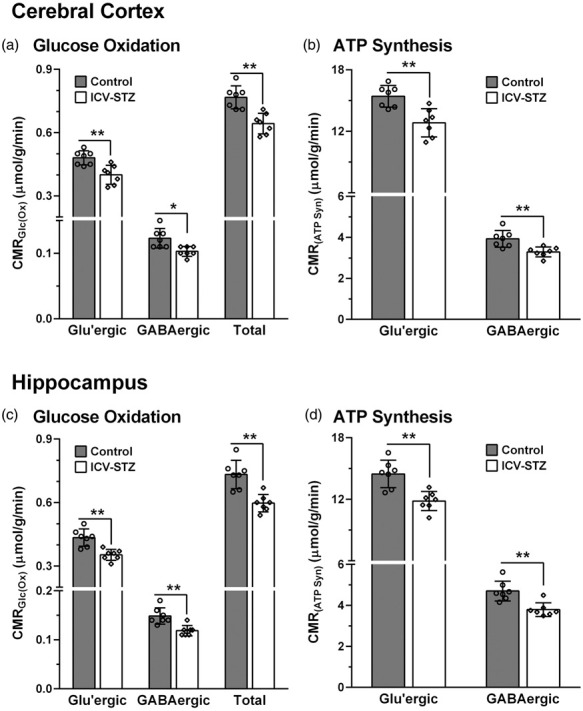
Cerebral Metabolic rates of: (a) Glucose oxidation (CMRGlc(Ox)) and (b) ATP synthesis (CMRATP(Syn)) in the cerebral cortex of ICV-STZ-treated (5 mg/kg) mice; (c) CMRGlc(Ox), and (d) CMRATP(Syn) in the hippocampus of STZ-treated mice. The 13C labeling of amino acids from [1,6-13C2]glucose was measured in the tissue extracts using 1H-[13C]-NMR spectroscopy. The CMRGlc(Ox) was calculated using Eqns. (4) to (6). The ATP synthesis rate was determined by multiplying the CMRGlc by a factor of 32. The vertical bar represents the mean±SD of the group, while the symbols depict individual values. *p < 0.05 and **p < 0.01 when ICV-STZ-treated mice were compared with controls.
