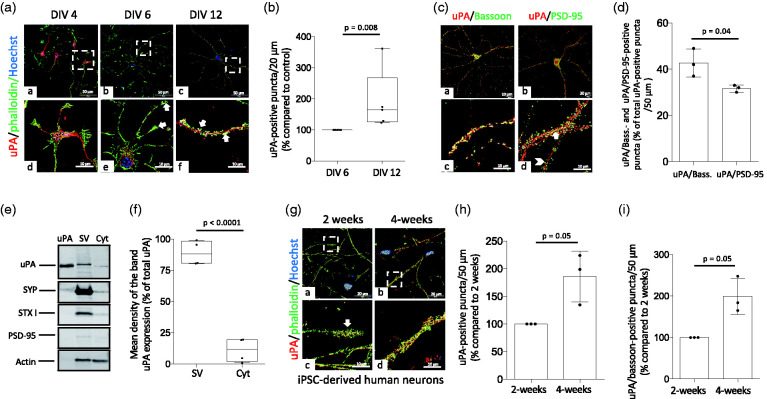
Figure 1.
uPA is found the presynaptic terminal of cerebral cortical neurons. (a) Representative confocal micrographs at 60× magnification of DIV-4, -6 & -12 murine cerebral cortical neurons immunostained with anti-uPA antibodies (red) and phalloidin (green). (b) Percentage of uPA-positive puncta/20 μm in extensions of DIV 12 murine cerebral cortical neurons compared to uPA-positive puncta in DIV 6 neurons. Each experiment was repeated with cells from 5 different cultures. Each data point is the average of 12 (DIV 6) and 9 (DIV 12) observations per culture. Mann-Whitney non-parametric test. (c and d) Representative confocal micrographs at 60× magnification of uPA (red), bassoon (green in a and c) and PSD-95 (green in b and d) expression (c), and mean percentage of either uPA/bassoon- or uPA/PSD-95-positive puncta in relation to the total number of uPA-positive puncta/50 μm extensions (d). Arrow in panel d depicts an example of an uPA/PSD-95-positive puncta. Arrowhead points to an example of a PSD-95-positive puncta that does not colocalize with uPA. Each experiment was repeated with DIV-16 neurons from 3 different cultures. Each data point is the average of 14 observations per culture. Two-tailed student’s t-test. (e and f) Representative immunoblotting (e) and quantification of the mean intensity of the band (f) of uPA, synaptophysin (SYP), syntaxin I (STX I), PSD-95 and actin expression in synaptic vesicles (SV) and cytoplasm (Cyt) from DIV-16 murine cerebral cortical neurons. Each observation was repeated with cortices extracted from 4 different animals. Two-tailed student’s t-test. (g) Representative confocal micrographs at 156× magnification of 2- and 4-weeks old induced pluripotent stem cell (iPSC)-derived neurons from healthy human donors stained with phalloidin (green) and anti-uPA antibodies (red). (h and i) Mean percentage of uPA- (h) and uPA/bassoon-positive puncta (i) in 4-weeks/old iPSC-derived neurons compared to uPA- and uPA/bassoon-positive puncta in 2 weeks/old iPSC-derived neurons stained as described in G. Each experiment was repeated with cells from three different cultures. Each data point is the average of 6 observations per culture. Mann-Whitney non-parametric test (h and i).

