Figure 2.
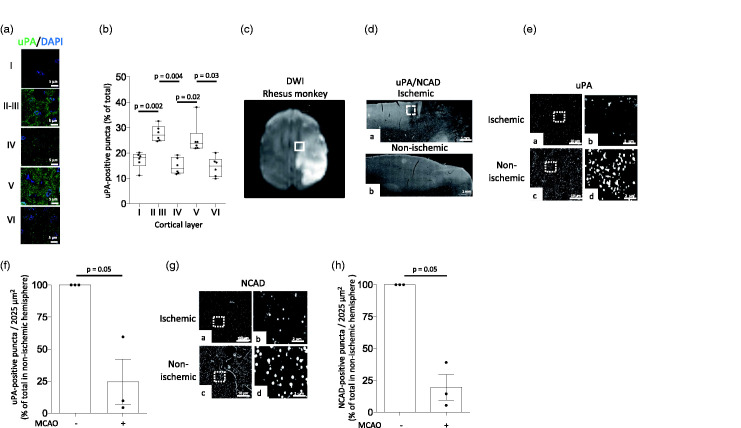
The expression of uPA decreases in the area surrounding the necrotic core. (a) Representative confocal micrographs at 282× magnification of individual cortical layers of the frontal cortex of the rhesus monkey immunostained with anti-uPA antibodies (green) and Hoechst (blue). (b) Percentage of uPA-positive puncta in individual cortical layers from the frontal cortex of 6 rhesus monkeys in relation to the total number of puncta in the six cortical layers of each animal. Each value represents the average of 10 confocal micrographs per animal. One-way ANOVA with Holm-Sidak’s multiple comparisons test. (c) Representative diffusion-weighted imaging (DWI) of an axial section of the brain of a rhesus monkey 24 hours after MCAO. The white square depicts one of the regions of interest surrounding the necrotic core where observations were made. (d) Representative micrographs at 4× magnification from the frontal cortex of a rhesus monkey immunostained with antibodies against uPA and NCAD 24 hours after MCAO. The white square in a denotes an area surrounding the necrotic core where uPA and NCAD expression are noticeably decreased. Panel b corresponds to a comparable area in the contralateral non-ischemic hemisphere. (e) Representative micrographs at 20× magnification of uPA expression in the area surrounding the necrotic core (a) and a comparable area in the contralateral non-ischemic hemisphere (c) of a rhesus monkey 24 hours after tMCAO. b and d correspond to a 5-fold electronic magnification of the area demarcated by the white squares in a and c, correspondingly. (f) Mean percentage of uPA-positive puncta in the II/III cortical layers of the area surrounding the necrotic core of 3 rhesus monkeys 24 hours after MCAO, in relation to the number of uPA-positive puncta in a comparable area in the non-ischemic hemisphere. n = 3 animals. Each data point represents the average of 5 micrographs per animal. Mann-Whitney non-parametric test. (g) Representative micrographs at 20× magnification of NCAD expression in the area surrounding the necrotic core (a) and a comparable area in the contralateral non-ischemic hemisphere (c) of a rhesus monkey 24 hours after tMCAO. b and d correspond to a 5-fold electronic magnification of the area demarcated by the white squares in a and c, correspondingly. (h) Mean percentage of NCAD-positive puncta in the II/III cortical layers of the area surrounding the necrotic core of 3 rhesus monkeys 24 hours after MCAO, in relation to the number of NCAD-positive puncta in a comparable area in the non-ischemic hemisphere. n = 3 animals. Each data point represents the average of 5 micrographs per animal. Mann-Whitney non-parametric test.

