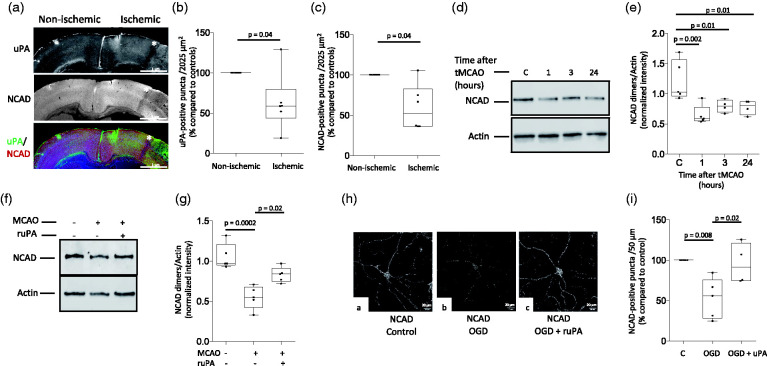
Figure 3.
Effect of uPA treatment on NCAD expression in the area surrounding the necrotic core. (a) Representative 10× micrographs through the murine frontal cortex stained with antibodies against either uPA or NCAD, or with a combination of anti-uPA and -NCAD antibodies 24 hours after 60 minutes of transient middle cerebral artery occlusion (tMCAO). Asterisks indicate a band of tissue outside the necrotic area were observations were performed. (b and c) Mean percentage of uPA- (b) and NCAD-positive puncta (c) in the II/III cortical layers of the area surrounding the necrotic core, compared to the number of uPA- and NCAD-positive puncta in a comparable area in the contralateral non-ischemic hemisphere, of 6 Wt mice 24 hours after tMCAO. Each value represents the average of 10 micrographs per animal. Mann-Whitney non-parametric test. (d and e) Representative Western blot analysis (d) and quantification of mean the intensity of the band (e) of NCAD expression in the murine cerebral cortex of sham-operated mice (control: C), or 1, 3 and 24 hours after tMCAO. n = 4–5 mice/group. One-way ANOVA with Holm-Sidak’s multiple comparisons test. (f and g) Representative Western bot analysis (f) and quantification of the mean intensity of the band (g) of NCAD expression in the murine cerebral cortex 3 hours after either sham operation or tMCAO. A sub-group of animals was intravenously treated with uPA 30 minutes before harvesting the brains. n = 5 animals per group. Statistical analysis: one-way ANOVA with Tukey’s multiple comparisons test. (h) Representative confocal micrographs at 60× magnification of murine cerebral cortical neurons immunostained with anti-NCAD antibodies 3 hours after exposure to 5 minutes of oxygen and glucose deprivation (OGD). Neurons were treated 30 minutes before the end of the experiment (2.5 hours) with 5 nM of uPA or a comparable volume of vehicle (control). (i) Percentage of NCAD-positive puncta/50 µm in neurons exposed to the experimental conditions described in h, compared to the number of NCAD-positive puncta in cells kept under normoxic conditions. Each experiment was repeated with cells from 5 (c, OGD) and 4 (OGD + uPA) different cultures, and data point represents the average of quantifications obtained in 8 extensions. One-way ANOVA with Tukey’s multiple comparisons test.

