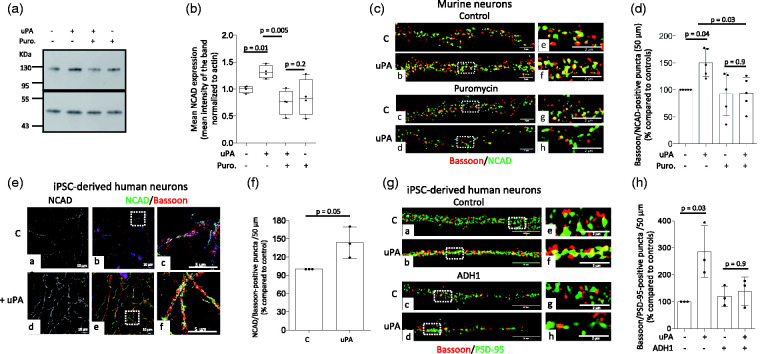
Figure 4.
uPA induces N-Cadherin-mediated formation of synaptic contacts. (a and b). Representative Western blot analysis (a) and quantification of the mean intensity of the band (b) of N-Cadherin (NCAD) expression in extracts prepared from murine cerebral cortical neurons incubated during 30 minutes with vehicle (control) or 5 nM of uPA, alone or in the presence of 270 µM of puromycin. n = 4 observations per group. Two-way ANOVA with Holm-Sidak’s multiple comparisons test. uPA-puromycin interaction: 3.9%. (c) Representative confocal micrographs at 240× magnification of extensions of murine cerebral cortical neurons incubated during 30 minutes with 5 nM of uPA, alone or in the presence of 270 µM of puromycin and then stained with antibodies against bassoon (red) and NCAD (green). (d) Mean percentage of bassoon/NCAD puncta in Wt cerebral cortical neurons exposed to the experimental conditions described in C. n = 5. Each data point represent the average of 5 observations per culture, for a total of 25 observations. Two-way ANOVA with Holme-Sidak’s multiple comparisons test. Interaction uPA – puromycin: 12.52%. (e) Representative confocal micrographs at 156× magnification of 4-weeks/old iPSC-derived neurons immunostained with antibodies against NCAD (green) and bassoon (red) after 30 minutes of treatment with uPA or vehicle (control). Panels c and f correspond to a 5-fold electronic magnification of the area demarcated by the white squares in b and e. (f) Mean percentage of NCAD/bassoon-positive puncta in 4-weeks/old iPSC-derived neurons treated with uPA, in relation to NCAD/bassoon-positive puncta in cells treated with vehicle (control). Each observation was repeated with neurons from 3 different cultures, and each data point is the average of 21 (control) and 20 (uPA-treated) observations. Mann-Whitney non-parametric test. (g) Representative confocal micrographs at 240× magnification of extensions from 4-weeks/old iPSC-derived neurons immunostained with antibodies against bassoon (red) and PSD-95 (green) following 30 minutes of treatment with either vehicle (control; a and e), 5 nM of uPA (b and f), or a combination of 175 µM of the NCAD inhibitor ADH1 and either vehicle (control; c and g) or uPA (d and h). e, f, g and h correspond to a 5× magnification of the area indicated by the dashed squares in a, b, c and d. (h) Mean percentage of bassoon/PSD-95 puncta in 4-weeks/old iPSC-derived neurons exposed to the experimental conditions described in G. n = 3. Each data point represent the average of 12 observations per culture. Two-way ANOVA with Holme-Sidak’s multiple comparisons test. Interaction uPA – ADH: 23.13%.

