
Figure 6.
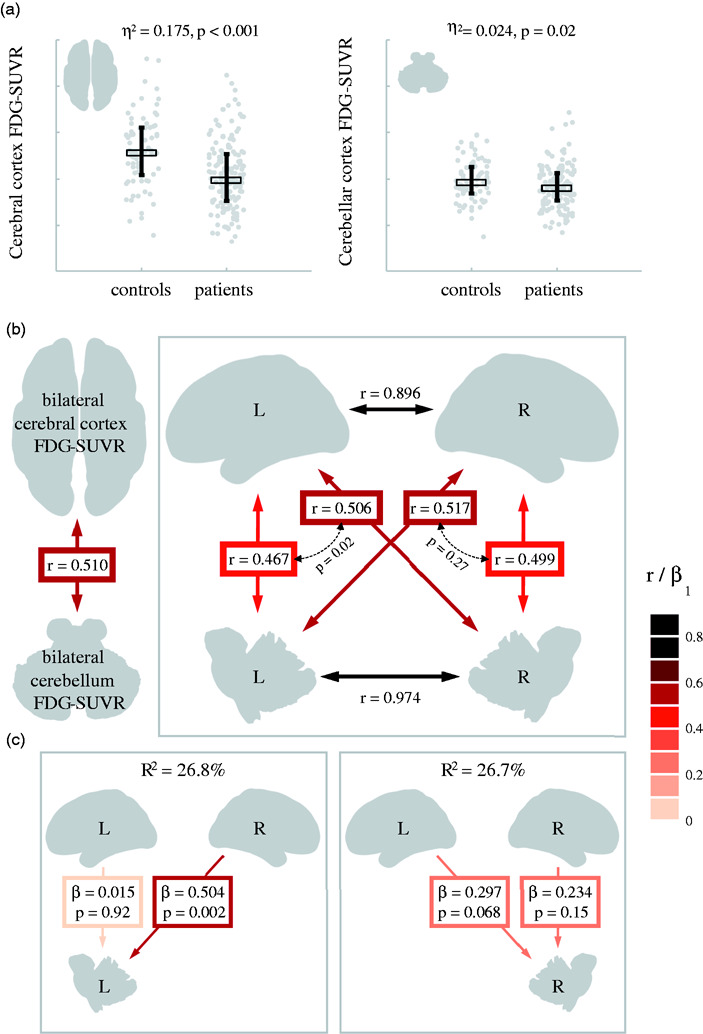
Relationships between cerebral and cerebellar cortex 18F-FDG-SUVR values in patients without significant cerebellar asymmetry.
a. Patients (n=146) versus controls (n = 74) 18F-FDG-SUVR comparisons in the whole cerebral and cerebellar cortices. All SUVR values are calculated using the pons as a reference region. Statistical comparisons include age as a covariate. Plots show individual values, medians (thick horizontal line) and interquartile ranges (vertical whiskers).
b. Bivariate associations between cerebral and cerebellar SUVRs in patients. Thick colored double-headed arrows indicate bivariate correlation coefficients; smaller dashed arrows represent the statistical comparison between two dependent correlations based on Fished r-to-z transformation.
c. Multiple regression models conducted in the patient group to assess the relative contribution of Left/Right cerebral cortex 18F-FDG-SUVR to each cerebellar hemisphere 18F-FDG-SUVR. β values are standardized regression estimates.