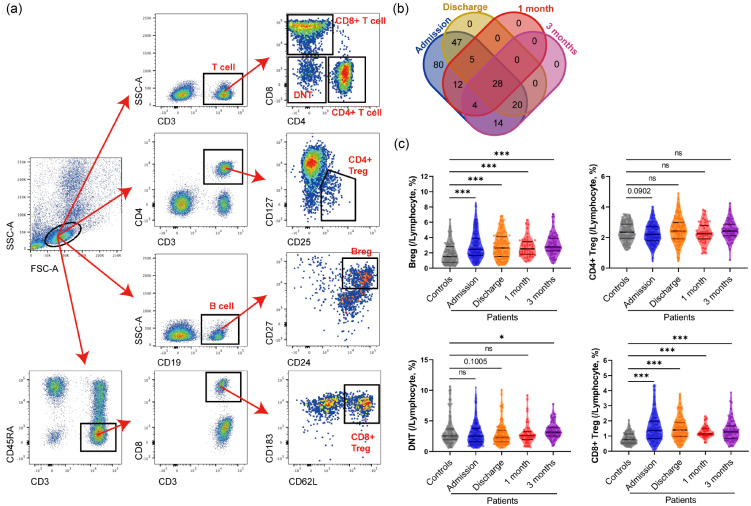
Figure 1.
Different clusters of regulating-cells in lymphocytes between control and different time points after acute ischemic stroke. (a) Representative flow cytometry analyses of total lymphocytes, B cells, T cells, CD4+ T cells, CD8+ T cells, Bregs, CD4+ Tregs, CD8+ Tregs, and DNTs. (b) Venn diagram of data at different time points. (c) Violin plots with median, 25 and 75% quartiles of the percentage of Bregs, DNTs, CD4+ Tregs, and CD8+ Tregs within lymphocytes of Controls (grey, n = 87) and different time points after acute ischemic stroke (Admission: blue, n = 210; Discharge: orange, n = 100; 1 month: red, n = 49; 3 months: purple, n = 66). Mann-Whitney test was employed to examine the difference between Controls and each time point. Decimals represent p-value. *: p < 0.05, ***: p < 0.001, ns: no significance.

