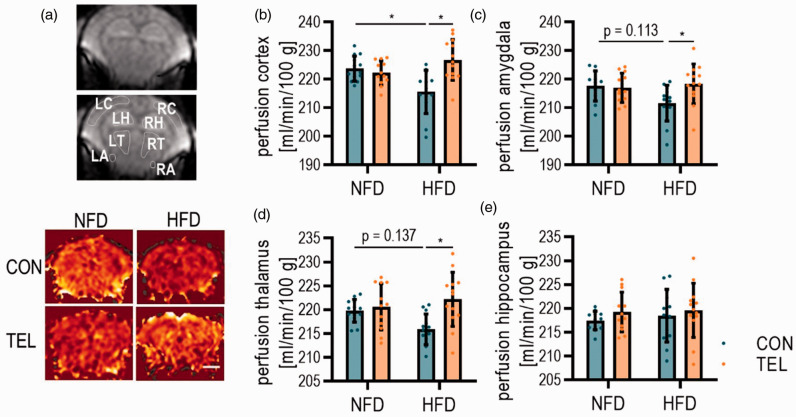
Figure 3.
TEL normalizes CBF upon HFD. Mice were fed with normal-fat (NFD) or high-fat diet (HFD) for 16 weeks and simultaneously treated with vehicle (CON) or telmisartan (TEL). (a) Representative images taken during ASL-MRI and indicated areas of interest for perfusion calculation (upper panel); LC left cortex; LH left hippocampus; LT left thalamus; LA left amygdala; RC right cortex; RH right hippocampus; RT right thalamus; RA right amygdala and representative images for each group during ASL-MRI (lower panel); scale bar 2 mm. Quantification of tissue perfusion in (b) cortex, (c) amygdala, (d) thalamus and (e) hippocampus. 2-way ANOVA results see table S4. n = 13 per group; *P < 0.05 in multiple comparison test; Data are means SD.

