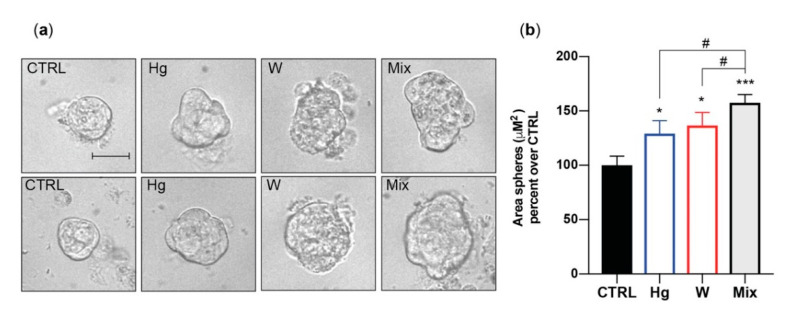
Figure 3.
Morphological changes induced by thyrosphere exposure to metals. (a) Representative phase-contrast images of thyrospheres grown for 8 days in standard medium (CTRL) or in medium with either 0.1 nM of HgCl2 or 30 nM Na2WO4. The metal mixture (MIX) included the metal salts of Cu, Hg, Pd, W, and Zn at the concentration causing the greatest effect on BrdU incorporation (see Table 1). The scale bar is 30 µM. (b) Average values of the thyrosphere size calculated by measuring sphere areas using the Image J software from NIH. The bars indicate the mean ± standard error of the mean of three independent experiments (* p < 0.05, *** p < 0.001 (relative to CTRL), # p < 0.05 (Hg and W vs. Mix)). Represented data from ref. [56].

