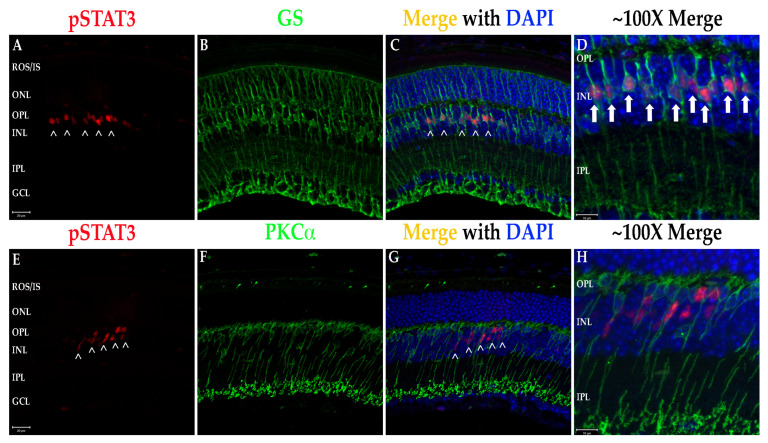
Figure 8.
STAT3 activation in the retinal INL is confined to Müller cell nuclei. (A–C) Q344X knock-in mouse retinal sections at 6 weeks of age were immunolabeled for pSTAT3 (red) and GS (green) and imaged at 40X magnification. Nuclei labeled with DAPI (blue). Scale bar = 20 mm. Arrowheads (>) indicate regions of pSTAT3 labeling. ROS/IS, rod outer segments/inner segments; ONL, outer nuclear layer; OPL, outer plexiform layer; INL, inner nuclear layer; IPL, inner plexiform layer; GCL, ganglion cell layer. (D) ~100X magnification merged image. Arrows indicate complete colocalization within Müller cell nuclei. Scale bar = 10 mm. (E–G) Q344X knock-in mouse retinal sections at 6 weeks of age were immunolabeled for pSTAT3 (red) and PKCa (green). Nuclei labeled with DAPI (blue). ROS/IS, rod outer segments/inner segments; ONL, outer nuclear layer; OPL, outer plexiform layer; INL, inner nuclear layer; IPL, inner plexiform layer; GCL, ganglion cell layer. Arrowheads (>) indicate regions of pSTAT3 labeling. Scale bar = 20 mm. (H) ~100X magnification merged image. No colocalization with rod bipolar cell nuclei is observed. Scale bar = 10 µm.

