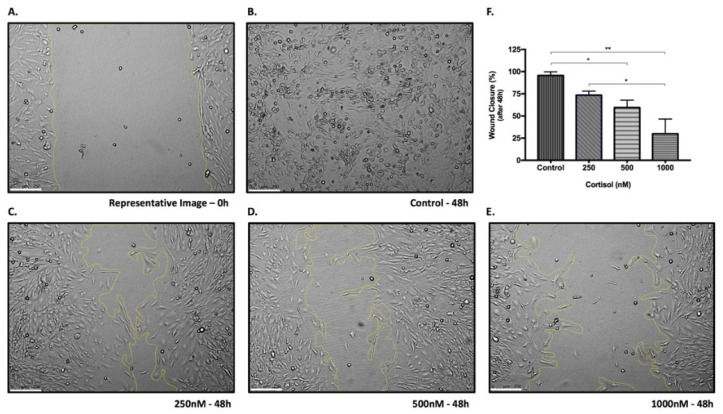
Figure 7.
Wound healing assay. Representative image of 0 h time-point (A) and representative images after 48 h of SGHPL-4 cells stimulation: vehicle (control) (B), 250 nM (C), 500 nM (D) and 1000 nM (E) of cortisol. Quantification of wound closure (%) after 48 h of stimulation (F). Data were compared by one-way ANOVA with Tukey multiple comparisons test. Data are presented as mean ± SEM. * p < 0.05, ** p < 0.01. Cell treatment was repeated three times. Scale bar = 250 µm.

